Brazilian vs Immigrants from Uzbekistan Median Male Earnings
COMPARE
Brazilian
Immigrants from Uzbekistan
Median Male Earnings
Median Male Earnings Comparison
Brazilians
Immigrants from Uzbekistan
$56,837
MEDIAN MALE EARNINGS
90.9/ 100
METRIC RATING
127th/ 347
METRIC RANK
$57,941
MEDIAN MALE EARNINGS
96.7/ 100
METRIC RATING
108th/ 347
METRIC RANK
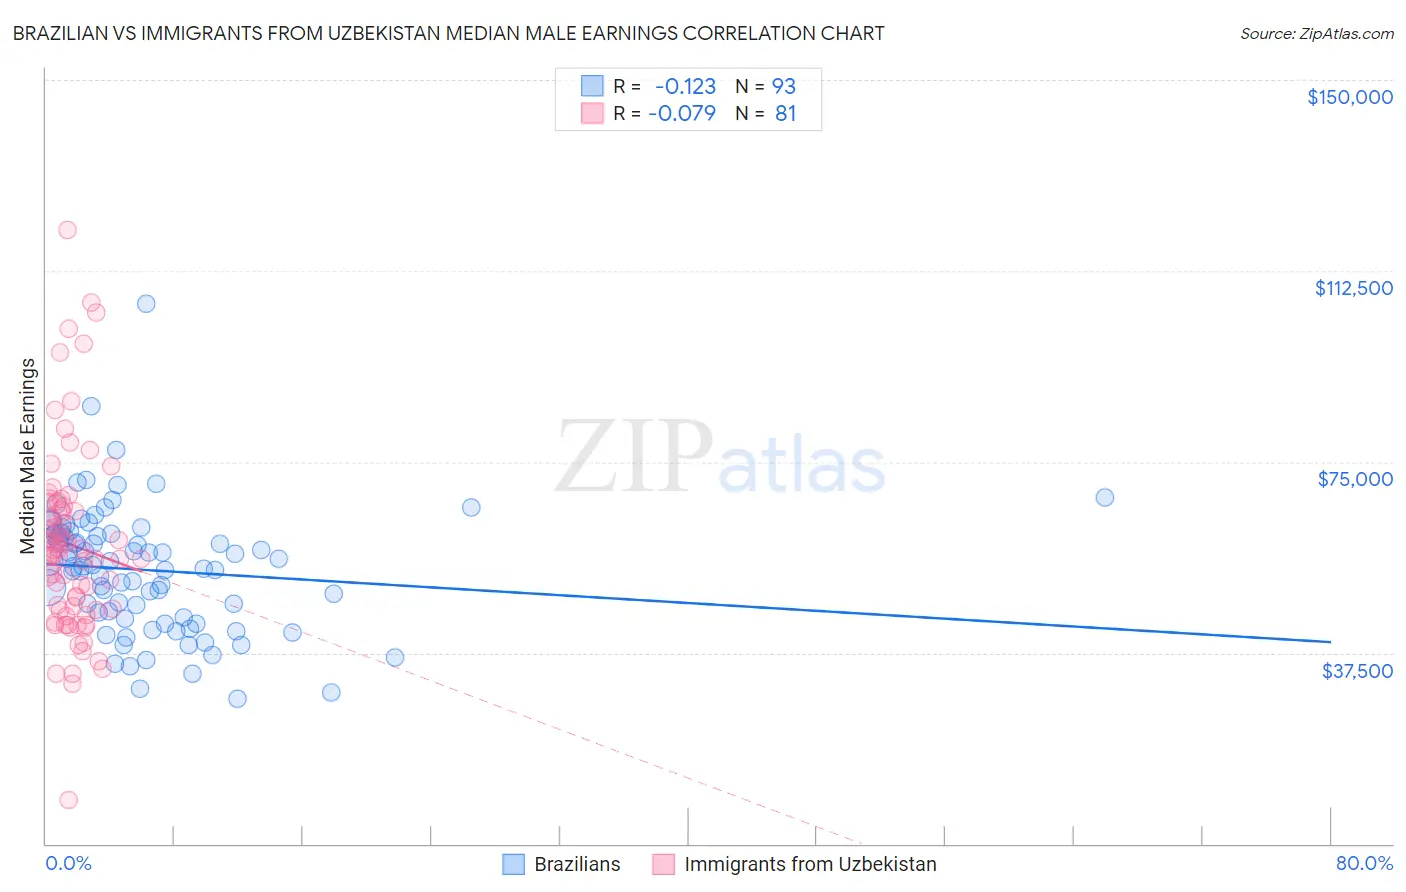
Brazilian vs Immigrants from Uzbekistan Median Male Earnings Correlation Chart
The statistical analysis conducted on geographies consisting of 323,892,839 people shows a poor negative correlation between the proportion of Brazilians and median male earnings in the United States with a correlation coefficient (R) of -0.123 and weighted average of $56,837. Similarly, the statistical analysis conducted on geographies consisting of 118,770,599 people shows a slight negative correlation between the proportion of Immigrants from Uzbekistan and median male earnings in the United States with a correlation coefficient (R) of -0.079 and weighted average of $57,941, a difference of 1.9%.
Median Male Earnings Correlation Summary
| Measurement | Brazilian | Immigrants from Uzbekistan |
| Minimum | $28,554 | $8,518 |
| Maximum | $105,938 | $120,441 |
| Range | $77,384 | $111,923 |
| Mean | $53,733 | $58,740 |
| Median | $54,435 | $56,668 |
| Interquartile 25% (IQ1) | $44,298 | $45,939 |
| Interquartile 75% (IQ3) | $60,844 | $66,644 |
| Interquartile Range (IQR) | $16,546 | $20,705 |
| Standard Deviation (Sample) | $12,418 | $18,622 |
| Standard Deviation (Population) | $12,351 | $18,506 |
Demographics Similar to Brazilians and Immigrants from Uzbekistan by Median Male Earnings
In terms of median male earnings, the demographic groups most similar to Brazilians are Chinese ($56,872, a difference of 0.060%), Immigrants from Morocco ($56,958, a difference of 0.21%), Chilean ($56,973, a difference of 0.24%), Immigrants from Jordan ($57,145, a difference of 0.54%), and Slovene ($57,145, a difference of 0.54%). Similarly, the demographic groups most similar to Immigrants from Uzbekistan are Serbian ($57,975, a difference of 0.060%), British ($57,890, a difference of 0.090%), Palestinian ($57,778, a difference of 0.28%), European ($57,637, a difference of 0.53%), and Immigrants from Afghanistan ($57,582, a difference of 0.62%).
| Demographics | Rating | Rank | Median Male Earnings |
| Serbians | 96.8 /100 | #107 | Exceptional $57,975 |
| Immigrants | Uzbekistan | 96.7 /100 | #108 | Exceptional $57,941 |
| British | 96.5 /100 | #109 | Exceptional $57,890 |
| Palestinians | 96.2 /100 | #110 | Exceptional $57,778 |
| Europeans | 95.6 /100 | #111 | Exceptional $57,637 |
| Immigrants | Afghanistan | 95.4 /100 | #112 | Exceptional $57,582 |
| Carpatho Rusyns | 95.3 /100 | #113 | Exceptional $57,572 |
| Immigrants | Kuwait | 95.3 /100 | #114 | Exceptional $57,562 |
| Swedes | 94.8 /100 | #115 | Exceptional $57,445 |
| Lebanese | 94.6 /100 | #116 | Exceptional $57,409 |
| Immigrants | Zimbabwe | 94.3 /100 | #117 | Exceptional $57,352 |
| Hungarians | 94.0 /100 | #118 | Exceptional $57,309 |
| Arabs | 94.0 /100 | #119 | Exceptional $57,298 |
| Canadians | 93.9 /100 | #120 | Exceptional $57,286 |
| Immigrants | Albania | 93.3 /100 | #121 | Exceptional $57,179 |
| Immigrants | Jordan | 93.1 /100 | #122 | Exceptional $57,145 |
| Slovenes | 93.1 /100 | #123 | Exceptional $57,145 |
| Chileans | 91.9 /100 | #124 | Exceptional $56,973 |
| Immigrants | Morocco | 91.8 /100 | #125 | Exceptional $56,958 |
| Chinese | 91.1 /100 | #126 | Exceptional $56,872 |
| Brazilians | 90.9 /100 | #127 | Exceptional $56,837 |