Brazilian vs Immigrants from Eritrea Single Mother Poverty
COMPARE
Brazilian
Immigrants from Eritrea
Single Mother Poverty
Single Mother Poverty Comparison
Brazilians
Immigrants from Eritrea
28.3%
SINGLE MOTHER POVERTY
92.4/ 100
METRIC RATING
118th/ 347
METRIC RANK
30.0%
SINGLE MOTHER POVERTY
7.7/ 100
METRIC RATING
221st/ 347
METRIC RANK
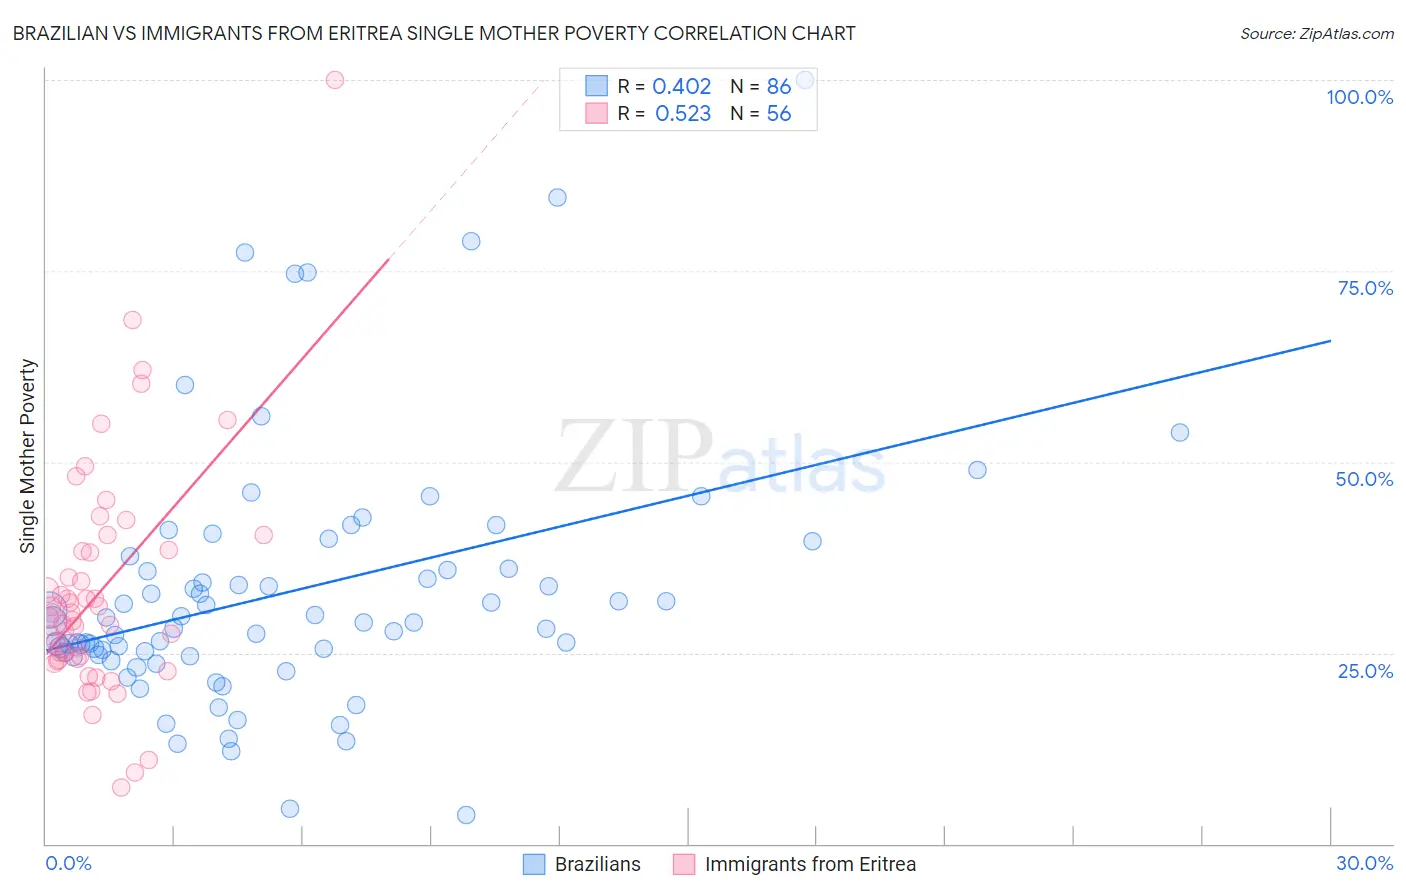
Brazilian vs Immigrants from Eritrea Single Mother Poverty Correlation Chart
The statistical analysis conducted on geographies consisting of 317,046,418 people shows a moderate positive correlation between the proportion of Brazilians and poverty level among single mothers in the United States with a correlation coefficient (R) of 0.402 and weighted average of 28.3%. Similarly, the statistical analysis conducted on geographies consisting of 104,521,443 people shows a substantial positive correlation between the proportion of Immigrants from Eritrea and poverty level among single mothers in the United States with a correlation coefficient (R) of 0.523 and weighted average of 30.0%, a difference of 6.1%.
Single Mother Poverty Correlation Summary
| Measurement | Brazilian | Immigrants from Eritrea |
| Minimum | 3.8% | 7.4% |
| Maximum | 100.0% | 100.0% |
| Range | 96.2% | 92.6% |
| Mean | 33.0% | 33.1% |
| Median | 29.0% | 29.9% |
| Interquartile 25% (IQ1) | 24.7% | 24.1% |
| Interquartile 75% (IQ3) | 36.1% | 38.4% |
| Interquartile Range (IQR) | 11.4% | 14.2% |
| Standard Deviation (Sample) | 16.9% | 15.5% |
| Standard Deviation (Population) | 16.8% | 15.3% |
Similar Demographics by Single Mother Poverty
Demographics Similar to Brazilians by Single Mother Poverty
In terms of single mother poverty, the demographic groups most similar to Brazilians are Australian (28.3%, a difference of 0.010%), Immigrants from Syria (28.3%, a difference of 0.010%), Immigrants from Uganda (28.3%, a difference of 0.020%), Cypriot (28.3%, a difference of 0.030%), and Immigrants from Kuwait (28.3%, a difference of 0.040%).
| Demographics | Rating | Rank | Single Mother Poverty |
| Venezuelans | 94.5 /100 | #111 | Exceptional 28.2% |
| Immigrants | Kazakhstan | 94.5 /100 | #112 | Exceptional 28.2% |
| Immigrants | South Africa | 93.2 /100 | #113 | Exceptional 28.3% |
| Immigrants | Western Asia | 92.7 /100 | #114 | Exceptional 28.3% |
| Immigrants | Kuwait | 92.7 /100 | #115 | Exceptional 28.3% |
| Immigrants | Uganda | 92.5 /100 | #116 | Exceptional 28.3% |
| Australians | 92.5 /100 | #117 | Exceptional 28.3% |
| Brazilians | 92.4 /100 | #118 | Exceptional 28.3% |
| Immigrants | Syria | 92.4 /100 | #119 | Exceptional 28.3% |
| Cypriots | 92.3 /100 | #120 | Exceptional 28.3% |
| Immigrants | Afghanistan | 92.1 /100 | #121 | Exceptional 28.3% |
| Colombians | 91.8 /100 | #122 | Exceptional 28.3% |
| Uruguayans | 91.7 /100 | #123 | Exceptional 28.3% |
| Immigrants | Switzerland | 91.7 /100 | #124 | Exceptional 28.3% |
| Kenyans | 90.9 /100 | #125 | Exceptional 28.4% |
Demographics Similar to Immigrants from Eritrea by Single Mother Poverty
In terms of single mother poverty, the demographic groups most similar to Immigrants from Eritrea are Sudanese (30.0%, a difference of 0.010%), Immigrants from Cuba (30.1%, a difference of 0.14%), German (30.0%, a difference of 0.17%), Immigrants from Sudan (30.1%, a difference of 0.21%), and Spanish (30.1%, a difference of 0.23%).
| Demographics | Rating | Rank | Single Mother Poverty |
| Liberians | 11.7 /100 | #214 | Poor 29.9% |
| Jamaicans | 11.7 /100 | #215 | Poor 29.9% |
| Immigrants | Western Africa | 11.5 /100 | #216 | Poor 29.9% |
| Immigrants | Ghana | 11.3 /100 | #217 | Poor 29.9% |
| Hungarians | 10.3 /100 | #218 | Poor 29.9% |
| Finns | 9.3 /100 | #219 | Tragic 30.0% |
| Germans | 8.8 /100 | #220 | Tragic 30.0% |
| Immigrants | Eritrea | 7.7 /100 | #221 | Tragic 30.0% |
| Sudanese | 7.6 /100 | #222 | Tragic 30.0% |
| Immigrants | Cuba | 6.9 /100 | #223 | Tragic 30.1% |
| Immigrants | Sudan | 6.5 /100 | #224 | Tragic 30.1% |
| Spanish | 6.3 /100 | #225 | Tragic 30.1% |
| Scottish | 6.0 /100 | #226 | Tragic 30.1% |
| Immigrants | Liberia | 5.9 /100 | #227 | Tragic 30.1% |
| Spaniards | 5.4 /100 | #228 | Tragic 30.2% |