Brazilian vs Immigrants from Uzbekistan Family Households
COMPARE
Brazilian
Immigrants from Uzbekistan
Family Households
Family Households Comparison
Brazilians
Immigrants from Uzbekistan
63.9%
FAMILY HOUSEHOLDS
12.4/ 100
METRIC RATING
205th/ 347
METRIC RANK
63.4%
FAMILY HOUSEHOLDS
1.5/ 100
METRIC RATING
247th/ 347
METRIC RANK
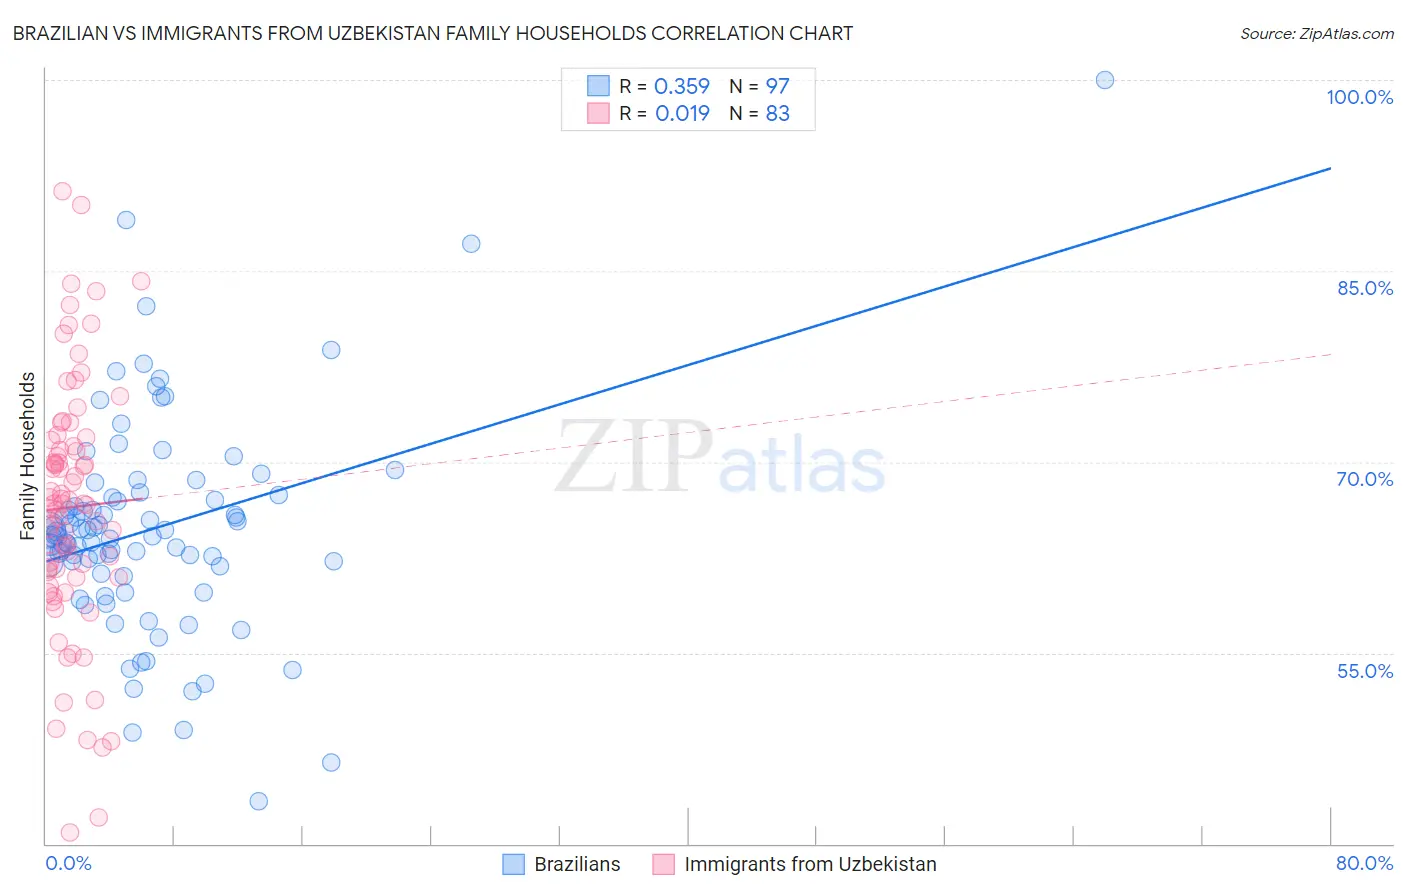
Brazilian vs Immigrants from Uzbekistan Family Households Correlation Chart
The statistical analysis conducted on geographies consisting of 323,732,843 people shows a mild positive correlation between the proportion of Brazilians and percentage of family households in the United States with a correlation coefficient (R) of 0.359 and weighted average of 63.9%. Similarly, the statistical analysis conducted on geographies consisting of 118,723,370 people shows no correlation between the proportion of Immigrants from Uzbekistan and percentage of family households in the United States with a correlation coefficient (R) of 0.019 and weighted average of 63.4%, a difference of 0.76%.
Family Households Correlation Summary
| Measurement | Brazilian | Immigrants from Uzbekistan |
| Minimum | 43.4% | 40.8% |
| Maximum | 100.0% | 91.2% |
| Range | 56.6% | 50.4% |
| Mean | 64.7% | 66.4% |
| Median | 64.2% | 66.7% |
| Interquartile 25% (IQ1) | 61.5% | 60.9% |
| Interquartile 75% (IQ3) | 67.3% | 71.7% |
| Interquartile Range (IQR) | 5.8% | 10.8% |
| Standard Deviation (Sample) | 8.5% | 9.9% |
| Standard Deviation (Population) | 8.4% | 9.9% |
Similar Demographics by Family Households
Demographics Similar to Brazilians by Family Households
In terms of family households, the demographic groups most similar to Brazilians are Immigrants from Uruguay (63.9%, a difference of 0.010%), Immigrants from Lithuania (63.9%, a difference of 0.010%), Iranian (63.9%, a difference of 0.030%), Norwegian (63.9%, a difference of 0.030%), and Nigerian (63.9%, a difference of 0.030%).
| Demographics | Rating | Rank | Family Households |
| Poles | 18.9 /100 | #198 | Poor 64.0% |
| Slavs | 18.6 /100 | #199 | Poor 64.0% |
| Immigrants | Malaysia | 17.9 /100 | #200 | Poor 64.0% |
| Immigrants | Eastern Europe | 17.2 /100 | #201 | Poor 64.0% |
| Iranians | 13.5 /100 | #202 | Poor 63.9% |
| Norwegians | 13.2 /100 | #203 | Poor 63.9% |
| Immigrants | Uruguay | 12.8 /100 | #204 | Poor 63.9% |
| Brazilians | 12.4 /100 | #205 | Poor 63.9% |
| Immigrants | Lithuania | 12.1 /100 | #206 | Poor 63.9% |
| Nigerians | 11.5 /100 | #207 | Poor 63.9% |
| Immigrants | Bangladesh | 11.4 /100 | #208 | Poor 63.9% |
| Sierra Leoneans | 11.2 /100 | #209 | Poor 63.9% |
| Immigrants | Thailand | 9.6 /100 | #210 | Tragic 63.8% |
| Shoshone | 9.4 /100 | #211 | Tragic 63.8% |
| Immigrants | Netherlands | 9.4 /100 | #212 | Tragic 63.8% |
Demographics Similar to Immigrants from Uzbekistan by Family Households
In terms of family households, the demographic groups most similar to Immigrants from Uzbekistan are Immigrants from Ghana (63.4%, a difference of 0.010%), Dominican (63.4%, a difference of 0.010%), Russian (63.4%, a difference of 0.020%), Eastern European (63.4%, a difference of 0.030%), and Immigrants from Dominica (63.4%, a difference of 0.030%).
| Demographics | Rating | Rank | Family Households |
| South Africans | 1.9 /100 | #240 | Tragic 63.4% |
| Immigrants | St. Vincent and the Grenadines | 1.9 /100 | #241 | Tragic 63.4% |
| Immigrants | Israel | 1.8 /100 | #242 | Tragic 63.4% |
| Immigrants | Czechoslovakia | 1.8 /100 | #243 | Tragic 63.4% |
| Eastern Europeans | 1.6 /100 | #244 | Tragic 63.4% |
| Immigrants | Dominica | 1.6 /100 | #245 | Tragic 63.4% |
| Immigrants | Ghana | 1.6 /100 | #246 | Tragic 63.4% |
| Immigrants | Uzbekistan | 1.5 /100 | #247 | Tragic 63.4% |
| Dominicans | 1.5 /100 | #248 | Tragic 63.4% |
| Russians | 1.4 /100 | #249 | Tragic 63.4% |
| Immigrants | Japan | 1.4 /100 | #250 | Tragic 63.4% |
| Taiwanese | 1.2 /100 | #251 | Tragic 63.3% |
| Bahamians | 1.1 /100 | #252 | Tragic 63.3% |
| Immigrants | Dominican Republic | 1.0 /100 | #253 | Tragic 63.3% |
| Slovaks | 1.0 /100 | #254 | Tragic 63.3% |