Brazilian vs Immigrants from Greece Single Mother Poverty
COMPARE
Brazilian
Immigrants from Greece
Single Mother Poverty
Single Mother Poverty Comparison
Brazilians
Immigrants from Greece
28.3%
SINGLE MOTHER POVERTY
92.4/ 100
METRIC RATING
118th/ 347
METRIC RANK
26.7%
SINGLE MOTHER POVERTY
99.9/ 100
METRIC RATING
41st/ 347
METRIC RANK
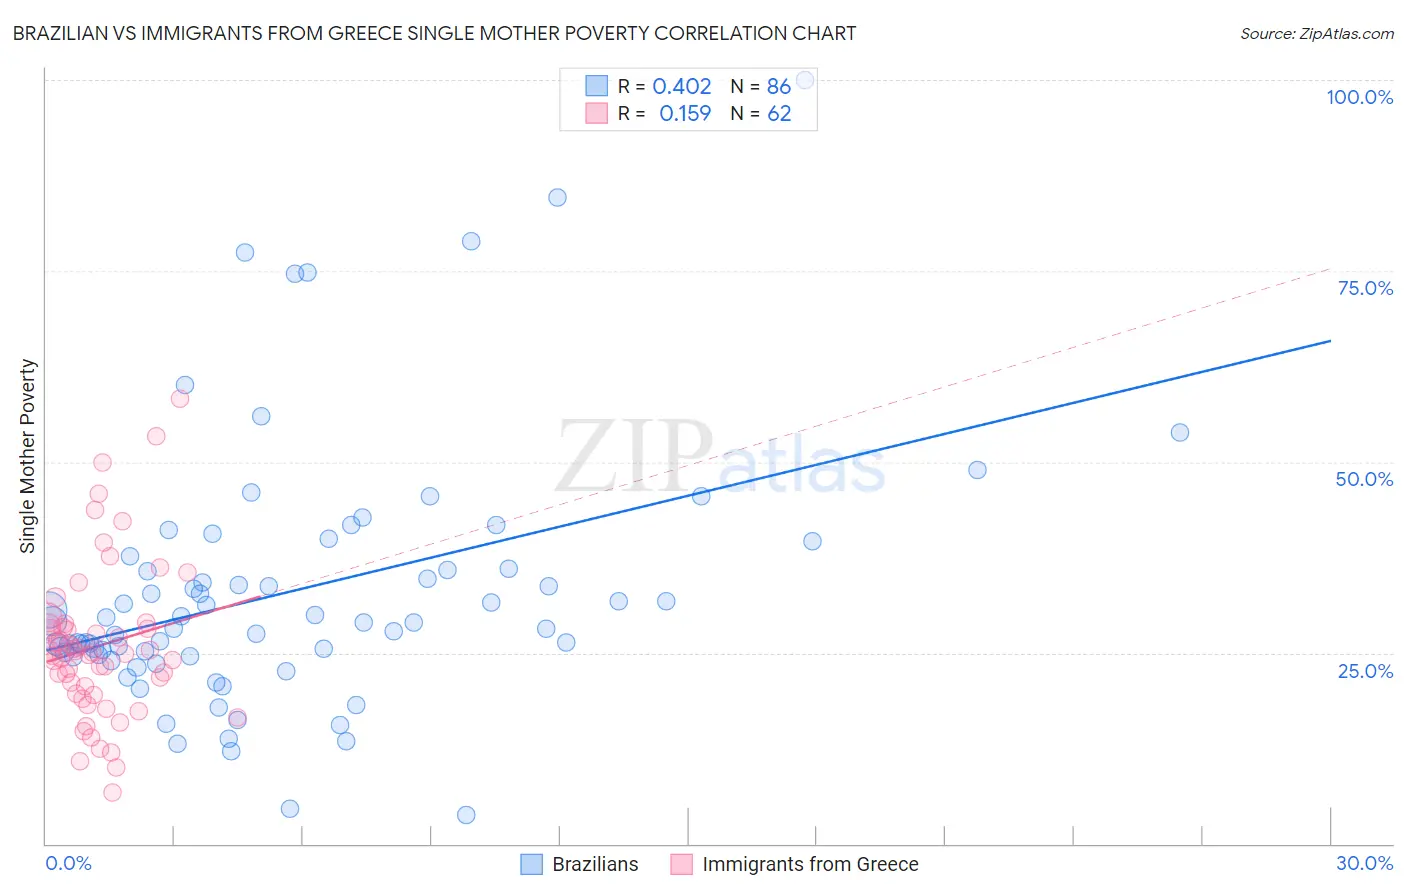
Brazilian vs Immigrants from Greece Single Mother Poverty Correlation Chart
The statistical analysis conducted on geographies consisting of 317,046,418 people shows a moderate positive correlation between the proportion of Brazilians and poverty level among single mothers in the United States with a correlation coefficient (R) of 0.402 and weighted average of 28.3%. Similarly, the statistical analysis conducted on geographies consisting of 212,076,443 people shows a poor positive correlation between the proportion of Immigrants from Greece and poverty level among single mothers in the United States with a correlation coefficient (R) of 0.159 and weighted average of 26.7%, a difference of 5.8%.
Single Mother Poverty Correlation Summary
| Measurement | Brazilian | Immigrants from Greece |
| Minimum | 3.8% | 6.7% |
| Maximum | 100.0% | 58.3% |
| Range | 96.2% | 51.6% |
| Mean | 33.0% | 25.9% |
| Median | 29.0% | 24.9% |
| Interquartile 25% (IQ1) | 24.7% | 19.6% |
| Interquartile 75% (IQ3) | 36.1% | 28.5% |
| Interquartile Range (IQR) | 11.4% | 8.9% |
| Standard Deviation (Sample) | 16.9% | 10.2% |
| Standard Deviation (Population) | 16.8% | 10.1% |
Similar Demographics by Single Mother Poverty
Demographics Similar to Brazilians by Single Mother Poverty
In terms of single mother poverty, the demographic groups most similar to Brazilians are Australian (28.3%, a difference of 0.010%), Immigrants from Syria (28.3%, a difference of 0.010%), Immigrants from Uganda (28.3%, a difference of 0.020%), Cypriot (28.3%, a difference of 0.030%), and Immigrants from Kuwait (28.3%, a difference of 0.040%).
| Demographics | Rating | Rank | Single Mother Poverty |
| Venezuelans | 94.5 /100 | #111 | Exceptional 28.2% |
| Immigrants | Kazakhstan | 94.5 /100 | #112 | Exceptional 28.2% |
| Immigrants | South Africa | 93.2 /100 | #113 | Exceptional 28.3% |
| Immigrants | Western Asia | 92.7 /100 | #114 | Exceptional 28.3% |
| Immigrants | Kuwait | 92.7 /100 | #115 | Exceptional 28.3% |
| Immigrants | Uganda | 92.5 /100 | #116 | Exceptional 28.3% |
| Australians | 92.5 /100 | #117 | Exceptional 28.3% |
| Brazilians | 92.4 /100 | #118 | Exceptional 28.3% |
| Immigrants | Syria | 92.4 /100 | #119 | Exceptional 28.3% |
| Cypriots | 92.3 /100 | #120 | Exceptional 28.3% |
| Immigrants | Afghanistan | 92.1 /100 | #121 | Exceptional 28.3% |
| Colombians | 91.8 /100 | #122 | Exceptional 28.3% |
| Uruguayans | 91.7 /100 | #123 | Exceptional 28.3% |
| Immigrants | Switzerland | 91.7 /100 | #124 | Exceptional 28.3% |
| Kenyans | 90.9 /100 | #125 | Exceptional 28.4% |
Demographics Similar to Immigrants from Greece by Single Mother Poverty
In terms of single mother poverty, the demographic groups most similar to Immigrants from Greece are Immigrants from Vietnam (26.7%, a difference of 0.070%), Sri Lankan (26.7%, a difference of 0.17%), Armenian (26.8%, a difference of 0.23%), Tsimshian (26.8%, a difference of 0.31%), and Immigrants from Sierra Leone (26.9%, a difference of 0.45%).
| Demographics | Rating | Rank | Single Mother Poverty |
| Immigrants | Indonesia | 99.9 /100 | #34 | Exceptional 26.6% |
| Maltese | 99.9 /100 | #35 | Exceptional 26.6% |
| Okinawans | 99.9 /100 | #36 | Exceptional 26.6% |
| Immigrants | Israel | 99.9 /100 | #37 | Exceptional 26.6% |
| Immigrants | Fiji | 99.9 /100 | #38 | Exceptional 26.6% |
| Sri Lankans | 99.9 /100 | #39 | Exceptional 26.7% |
| Immigrants | Vietnam | 99.9 /100 | #40 | Exceptional 26.7% |
| Immigrants | Greece | 99.9 /100 | #41 | Exceptional 26.7% |
| Armenians | 99.9 /100 | #42 | Exceptional 26.8% |
| Tsimshian | 99.9 /100 | #43 | Exceptional 26.8% |
| Immigrants | Sierra Leone | 99.9 /100 | #44 | Exceptional 26.9% |
| Latvians | 99.9 /100 | #45 | Exceptional 26.9% |
| Immigrants | Serbia | 99.9 /100 | #46 | Exceptional 26.9% |
| Egyptians | 99.8 /100 | #47 | Exceptional 26.9% |
| Immigrants | Poland | 99.8 /100 | #48 | Exceptional 26.9% |