Brazilian vs Burmese Single Mother Poverty

COMPARE

Brazilian
Race
Ancestry
AfghanAfricanAlaska NativeAlaskan AthabascanAlbanianAleutAlsatianAmericanApacheArabArapahoArgentineanArmenianAssyrian/Chaldean/SyriacAustralianAustrianBahamianBangladeshiBarbadianBasqueBelgianBelizeanBermudanBhutaneseBlackfeetBolivianBrazilianBritishBritish West IndianBulgarianCajunCambodianCanadianCape VerdeanCarpatho RusynCelticCentral AmericanCentral American IndianCherokeeCheyenneChickasawChileanChineseChippewaChoctawColombianColvilleComancheCosta RicanCreeCreekCroatianCrowCubanCypriotCzechCzechoslovakianDanishDelawareDominicanDutchDutch West IndianEastern EuropeanEcuadorianEgyptianEnglishEstonianEthiopianEuropeanFijianFilipinoFinnishFrenchFrench American IndianFrench CanadianGermanGerman RussianGhanaianGreekGuamanian/ChamorroGuatemalanGuyaneseHaitianHmongHonduranHopiHoumaHungarianIcelanderIndian (Asian)IndonesianInupiatIranianIraqiIrishIroquoisIsraeliItalianJamaicanJapaneseJordanianKenyanKiowaKoreanLaotianLatvianLebaneseLiberianLithuanianLumbeeLuxembourgerMacedonianMalaysianMalteseMarshalleseMenomineeMexicanMexican American IndianMongolianMoroccanNative HawaiianNavajoNepaleseNew ZealanderNicaraguanNigerianNorthern EuropeanNorwegianOkinawanOsageOttawaPaiutePakistaniPalestinianPanamanianParaguayanPennsylvania GermanPeruvianPimaPolishPortuguesePotawatomiPuebloPuerto RicanPuget Sound SalishRomanianRussianSalvadoranSamoanScandinavianScotch-IrishScottishSeminoleSenegaleseSerbianShoshoneSierra LeoneanSiouxSlavicSlovakSloveneSomaliSouth AfricanSouth AmericanSouth American IndianSoviet UnionSpaniardSpanishSpanish AmericanSpanish American IndianSri LankanSubsaharan AfricanSudaneseSwedishSwissSyrianTaiwaneseThaiTlingit-HaidaTohono O'OdhamTonganTrinidadian and TobagonianTsimshianTurkishU.S. Virgin IslanderUgandanUkrainianUruguayanUteVenezuelanVietnameseWelshWest IndianYakamaYaquiYugoslavianYumanYup'ikZimbabwean
Immigration
NonimmigrantsImmigrantsAfghanistanAfricaAlbaniaArgentinaArmeniaAsiaAustraliaAustriaBahamasBangladeshBarbadosBelarusBelgiumBelizeBoliviaBosnia and HerzegovinaBrazilBulgariaBurma/MyanmarCabo VerdeCambodiaCameroonCanadaCaribbeanCentral AmericaChileChinaColombiaCongoCosta RicaCroatiaCubaCzechoslovakiaDenmarkDominicaDominican RepublicEastern AfricaEastern AsiaEastern EuropeEcuadorEgyptEl SalvadorEnglandEritreaEthiopiaEuropeFijiFranceGermanyGhanaGreeceGrenadaGuatemalaGuyanaHaitiHondurasHong KongHungaryIndiaIndonesiaIranIraqIrelandIsraelItalyJamaicaJapanJordanKazakhstanKenyaKoreaKuwaitLaosLatin AmericaLatviaLebanonLiberiaLithuaniaMalaysiaMexicoMicronesiaMiddle AfricaMoldovaMoroccoNepalNetherlandsNicaraguaNigeriaNorth AmericaNorth MacedoniaNorthern AfricaNorthern EuropeNorwayOceaniaPakistanPanamaPeruPhilippinesPolandPortugalRomaniaRussiaSaudi ArabiaScotlandSenegalSerbiaSierra LeoneSingaporeSomaliaSouth AfricaSouth AmericaSouth Central AsiaSouth Eastern AsiaSouthern EuropeSpainSri LankaSt. Vincent and the GrenadinesSudanSwedenSwitzerlandSyriaTaiwanThailandTrinidad and TobagoTurkeyUgandaUkraineUruguayUzbekistanVenezuelaVietnamWest IndiesWestern AfricaWestern AsiaWestern EuropeYemenZaireZimbabweAzores
Burmese
Race
Ancestry
AfghanAfricanAlaska NativeAlaskan AthabascanAlbanianAleutAlsatianAmericanApacheArabArapahoArgentineanArmenianAssyrian/Chaldean/SyriacAustralianAustrianBahamianBangladeshiBarbadianBasqueBelgianBelizeanBermudanBhutaneseBlackfeetBolivianBritishBritish West IndianBulgarianBurmeseCajunCambodianCanadianCape VerdeanCarpatho RusynCelticCentral AmericanCentral American IndianCherokeeCheyenneChickasawChileanChineseChippewaChoctawColombianColvilleComancheCosta RicanCreeCreekCroatianCrowCubanCypriotCzechCzechoslovakianDanishDelawareDominicanDutchDutch West IndianEastern EuropeanEcuadorianEgyptianEnglishEstonianEthiopianEuropeanFijianFilipinoFinnishFrenchFrench American IndianFrench CanadianGermanGerman RussianGhanaianGreekGuamanian/ChamorroGuatemalanGuyaneseHaitianHmongHonduranHopiHoumaHungarianIcelanderIndian (Asian)IndonesianInupiatIranianIraqiIrishIroquoisIsraeliItalianJamaicanJapaneseJordanianKenyanKiowaKoreanLaotianLatvianLebaneseLiberianLithuanianLumbeeLuxembourgerMacedonianMalaysianMalteseMarshalleseMenomineeMexicanMexican American IndianMongolianMoroccanNative HawaiianNavajoNepaleseNew ZealanderNicaraguanNigerianNorthern EuropeanNorwegianOkinawanOsageOttawaPaiutePakistaniPalestinianPanamanianParaguayanPennsylvania GermanPeruvianPimaPolishPortuguesePotawatomiPuebloPuerto RicanPuget Sound SalishRomanianRussianSalvadoranSamoanScandinavianScotch-IrishScottishSeminoleSenegaleseSerbianShoshoneSierra LeoneanSiouxSlavicSlovakSloveneSomaliSouth AfricanSouth AmericanSouth American IndianSoviet UnionSpaniardSpanishSpanish AmericanSpanish American IndianSri LankanSubsaharan AfricanSudaneseSwedishSwissSyrianTaiwaneseThaiTlingit-HaidaTohono O'OdhamTonganTrinidadian and TobagonianTsimshianTurkishU.S. Virgin IslanderUgandanUkrainianUruguayanUteVenezuelanVietnameseWelshWest IndianYakamaYaquiYugoslavianYumanYup'ikZimbabwean
Immigration
NonimmigrantsImmigrantsAfghanistanAfricaAlbaniaArgentinaArmeniaAsiaAustraliaAustriaBahamasBangladeshBarbadosBelarusBelgiumBelizeBoliviaBosnia and HerzegovinaBrazilBulgariaBurma/MyanmarCabo VerdeCambodiaCameroonCanadaCaribbeanCentral AmericaChileChinaColombiaCongoCosta RicaCroatiaCubaCzechoslovakiaDenmarkDominicaDominican RepublicEastern AfricaEastern AsiaEastern EuropeEcuadorEgyptEl SalvadorEnglandEritreaEthiopiaEuropeFijiFranceGermanyGhanaGreeceGrenadaGuatemalaGuyanaHaitiHondurasHong KongHungaryIndiaIndonesiaIranIraqIrelandIsraelItalyJamaicaJapanJordanKazakhstanKenyaKoreaKuwaitLaosLatin AmericaLatviaLebanonLiberiaLithuaniaMalaysiaMexicoMicronesiaMiddle AfricaMoldovaMoroccoNepalNetherlandsNicaraguaNigeriaNorth AmericaNorth MacedoniaNorthern AfricaNorthern EuropeNorwayOceaniaPakistanPanamaPeruPhilippinesPolandPortugalRomaniaRussiaSaudi ArabiaScotlandSenegalSerbiaSierra LeoneSingaporeSomaliaSouth AfricaSouth AmericaSouth Central AsiaSouth Eastern AsiaSouthern EuropeSpainSri LankaSt. Vincent and the GrenadinesSudanSwedenSwitzerlandSyriaTaiwanThailandTrinidad and TobagoTurkeyUgandaUkraineUruguayUzbekistanVenezuelaVietnamWest IndiesWestern AfricaWestern AsiaWestern EuropeYemenZaireZimbabweAzores
Single Mother Poverty
Income
Poverty
Unemployment
Labor Participation
Family Structure
Vehicle Availability
Education Level
Disability

Single Mother Poverty Comparison

Brazilians

Burmese

Exceptional
Exceptional
28.3%
SINGLE MOTHER POVERTY
92.4/ 100
METRIC RATING
118th/ 347
METRIC RANK
26.2%
SINGLE MOTHER POVERTY
100.0/ 100
METRIC RATING
23rd/ 347
METRIC RANK

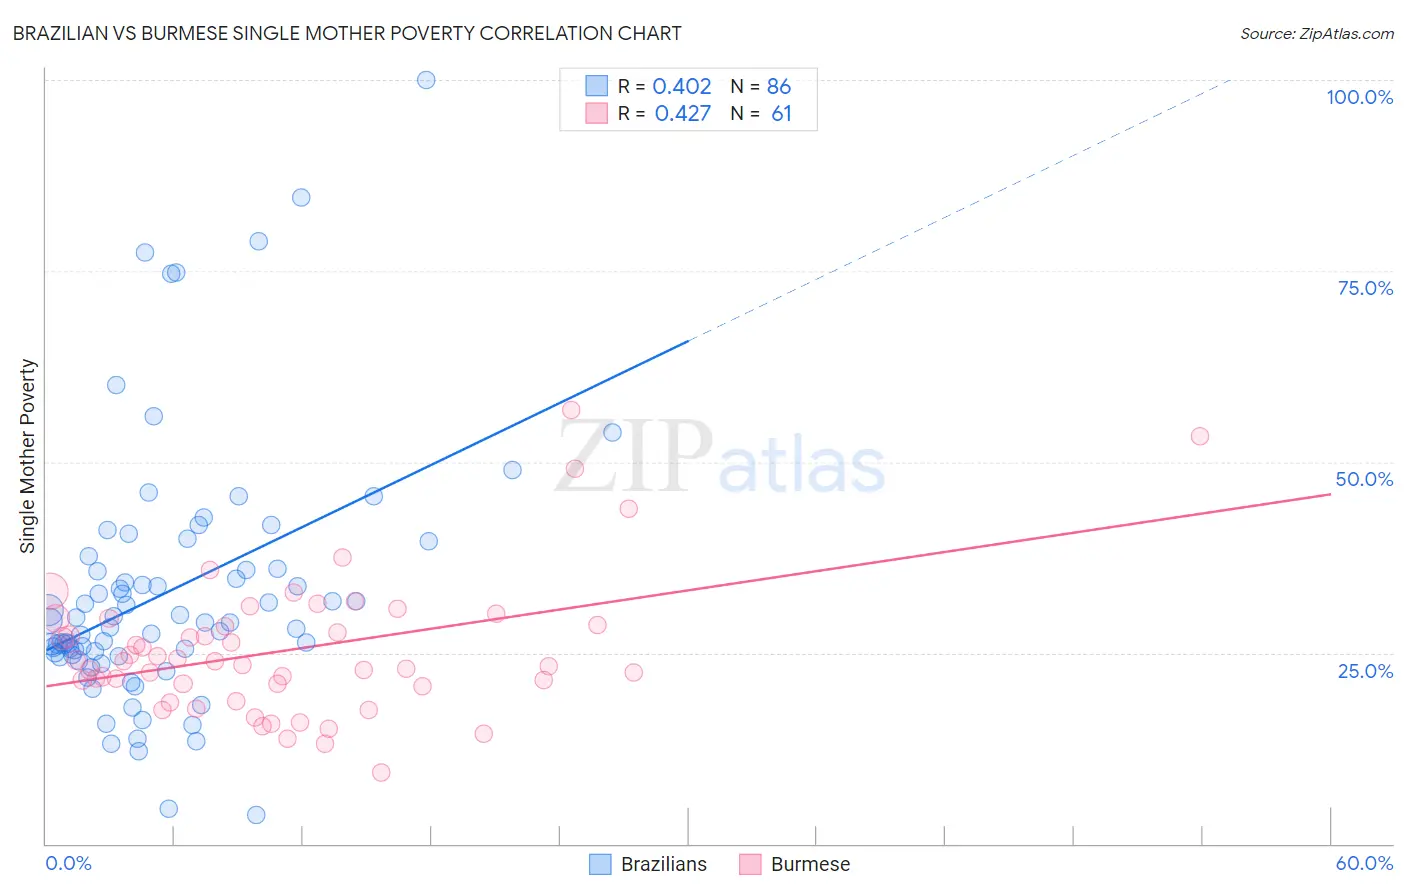
Brazilian vs Burmese Single Mother Poverty Correlation Chart

The statistical analysis conducted on geographies consisting of 317,046,418 people shows a moderate positive correlation between the proportion of Brazilians and poverty level among single mothers in the United States with a correlation coefficient (R) of 0.402 and weighted average of 28.3%. Similarly, the statistical analysis conducted on geographies consisting of 450,482,396 people shows a moderate positive correlation between the proportion of Burmese and poverty level among single mothers in the United States with a correlation coefficient (R) of 0.427 and weighted average of 26.2%, a difference of 7.8%.
Brazilian vs Burmese Single Mother Poverty

Single Mother Poverty Correlation Summary

MeasurementBrazilianBurmese
Minimum3.8%9.3%
Maximum100.0%56.9%
Range96.2%47.5%
Mean33.0%25.3%
Median29.0%23.9%
Interquartile 25% (IQ1)24.7%20.8%
Interquartile 75% (IQ3)36.1%29.0%
Interquartile Range (IQR)11.4%8.3%
Standard Deviation (Sample)16.9%9.0%
Standard Deviation (Population)16.8%9.0%

Similar Demographics by Single Mother Poverty

Demographics Similar to Brazilians by Single Mother Poverty

In terms of single mother poverty, the demographic groups most similar to Brazilians are Australian (28.3%, a difference of 0.010%), Immigrants from Syria (28.3%, a difference of 0.010%), Immigrants from Uganda (28.3%, a difference of 0.020%), Cypriot (28.3%, a difference of 0.030%), and Immigrants from Kuwait (28.3%, a difference of 0.040%).
DemographicsRating | RankSingle Mother Poverty
Venezuelans
94.5
/100
|
#111
Exceptional
28.2%
Immigrants | Kazakhstan
94.5
/100
|
#112
Exceptional
28.2%
Immigrants | South Africa
93.2
/100
|
#113
Exceptional
28.3%
Immigrants | Western Asia
92.7
/100
|
#114
Exceptional
28.3%
Immigrants | Kuwait
92.7
/100
|
#115
Exceptional
28.3%
Immigrants | Uganda
92.5
/100
|
#116
Exceptional
28.3%
Australians
92.5
/100
|
#117
Exceptional
28.3%
Brazilians
92.4
/100
|
#118
Exceptional
28.3%
Immigrants | Syria
92.4
/100
|
#119
Exceptional
28.3%
Cypriots
92.3
/100
|
#120
Exceptional
28.3%
Immigrants | Afghanistan
92.1
/100
|
#121
Exceptional
28.3%
Colombians
91.8
/100
|
#122
Exceptional
28.3%
Uruguayans
91.7
/100
|
#123
Exceptional
28.3%
Immigrants | Switzerland
91.7
/100
|
#124
Exceptional
28.3%
Kenyans
90.9
/100
|
#125
Exceptional
28.4%

Demographics Similar to Burmese by Single Mother Poverty

In terms of single mother poverty, the demographic groups most similar to Burmese are Immigrants from Moldova (26.2%, a difference of 0.020%), Immigrants from Korea (26.2%, a difference of 0.17%), Immigrants from Asia (26.3%, a difference of 0.22%), Immigrants from Bolivia (26.2%, a difference of 0.35%), and Immigrants from Sri Lanka (26.3%, a difference of 0.35%).
DemographicsRating | RankSingle Mother Poverty
Bolivians
100.0
/100
|
#16
Exceptional
25.9%
Asians
100.0
/100
|
#17
Exceptional
26.0%
Immigrants | Pakistan
100.0
/100
|
#18
Exceptional
26.0%
Immigrants | Eastern Asia
100.0
/100
|
#19
Exceptional
26.1%
Immigrants | China
100.0
/100
|
#20
Exceptional
26.1%
Immigrants | Bolivia
100.0
/100
|
#21
Exceptional
26.2%
Immigrants | Korea
100.0
/100
|
#22
Exceptional
26.2%
Burmese
100.0
/100
|
#23
Exceptional
26.2%
Immigrants | Moldova
100.0
/100
|
#24
Exceptional
26.2%
Immigrants | Asia
100.0
/100
|
#25
Exceptional
26.3%
Immigrants | Sri Lanka
100.0
/100
|
#26
Exceptional
26.3%
Immigrants | Japan
100.0
/100
|
#27
Exceptional
26.4%
Koreans
100.0
/100
|
#28
Exceptional
26.4%
Jordanians
100.0
/100
|
#29
Exceptional
26.4%
Turks
100.0
/100
|
#30
Exceptional
26.4%