Alaska Native vs Immigrants from Uzbekistan Single Mother Poverty
COMPARE
Alaska Native
Immigrants from Uzbekistan
Single Mother Poverty
Single Mother Poverty Comparison
Alaska Natives
Immigrants from Uzbekistan
30.9%
SINGLE MOTHER POVERTY
0.6/ 100
METRIC RATING
252nd/ 347
METRIC RANK
29.3%
SINGLE MOTHER POVERTY
42.6/ 100
METRIC RATING
179th/ 347
METRIC RANK
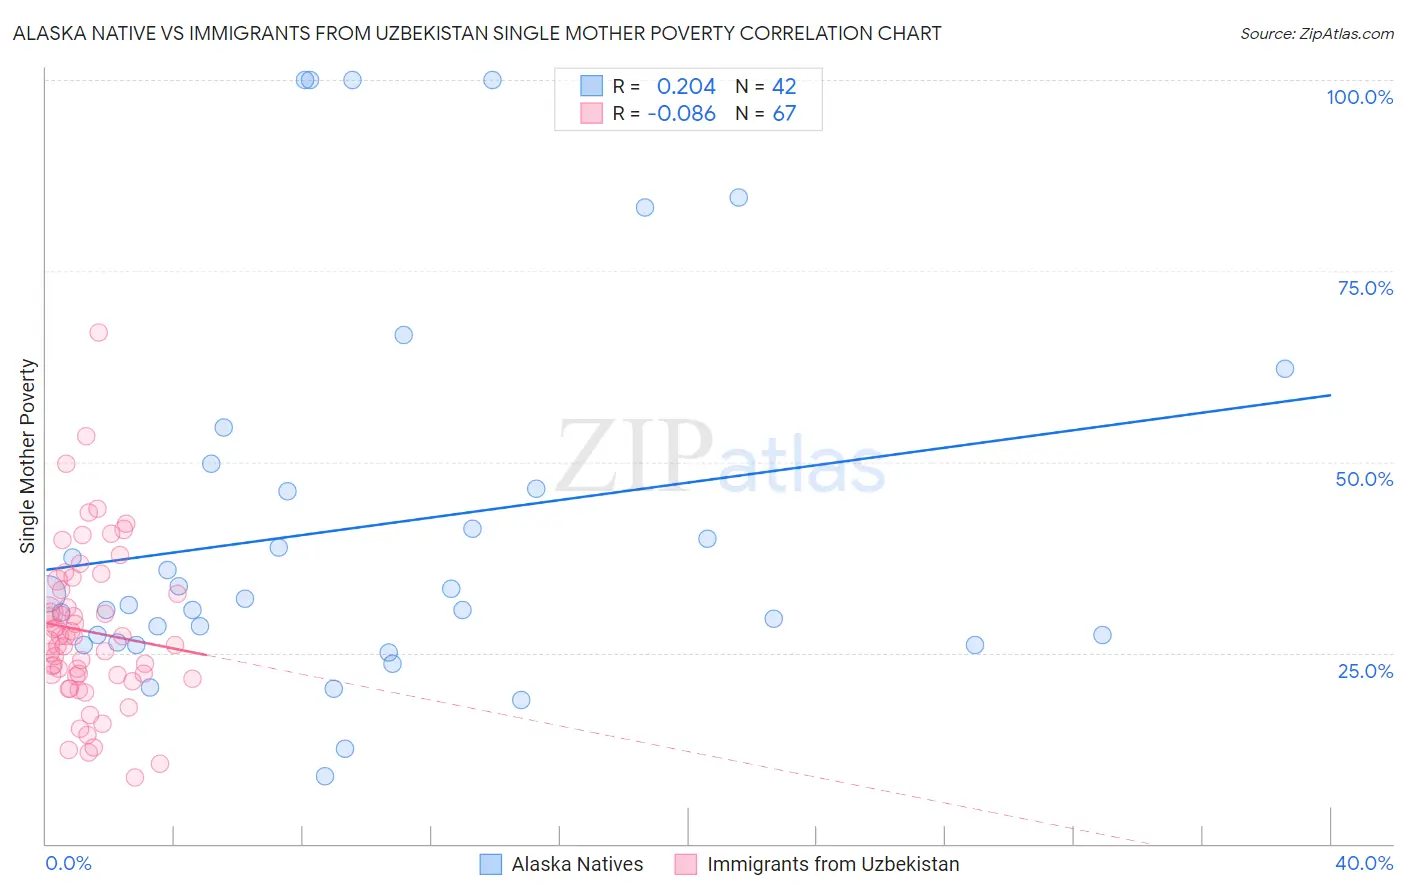
Alaska Native vs Immigrants from Uzbekistan Single Mother Poverty Correlation Chart
The statistical analysis conducted on geographies consisting of 76,488,214 people shows a weak positive correlation between the proportion of Alaska Natives and poverty level among single mothers in the United States with a correlation coefficient (R) of 0.204 and weighted average of 30.9%. Similarly, the statistical analysis conducted on geographies consisting of 117,476,483 people shows a slight negative correlation between the proportion of Immigrants from Uzbekistan and poverty level among single mothers in the United States with a correlation coefficient (R) of -0.086 and weighted average of 29.3%, a difference of 5.7%.
Single Mother Poverty Correlation Summary
| Measurement | Alaska Native | Immigrants from Uzbekistan |
| Minimum | 8.8% | 8.7% |
| Maximum | 100.0% | 67.0% |
| Range | 91.2% | 58.3% |
| Mean | 41.6% | 27.8% |
| Median | 31.7% | 26.3% |
| Interquartile 25% (IQ1) | 26.3% | 21.9% |
| Interquartile 75% (IQ3) | 46.5% | 33.2% |
| Interquartile Range (IQR) | 20.2% | 11.3% |
| Standard Deviation (Sample) | 24.9% | 10.5% |
| Standard Deviation (Population) | 24.6% | 10.4% |
Similar Demographics by Single Mother Poverty
Demographics Similar to Alaska Natives by Single Mother Poverty
In terms of single mother poverty, the demographic groups most similar to Alaska Natives are Tlingit-Haida (30.9%, a difference of 0.010%), Celtic (30.9%, a difference of 0.030%), Vietnamese (30.9%, a difference of 0.13%), Senegalese (31.0%, a difference of 0.18%), and Cape Verdean (30.8%, a difference of 0.28%).
| Demographics | Rating | Rank | Single Mother Poverty |
| Barbadians | 1.3 /100 | #245 | Tragic 30.7% |
| Ecuadorians | 0.9 /100 | #246 | Tragic 30.8% |
| West Indians | 0.9 /100 | #247 | Tragic 30.8% |
| French Canadians | 0.9 /100 | #248 | Tragic 30.8% |
| Cape Verdeans | 0.8 /100 | #249 | Tragic 30.8% |
| Vietnamese | 0.7 /100 | #250 | Tragic 30.9% |
| Tlingit-Haida | 0.6 /100 | #251 | Tragic 30.9% |
| Alaska Natives | 0.6 /100 | #252 | Tragic 30.9% |
| Celtics | 0.6 /100 | #253 | Tragic 30.9% |
| Senegalese | 0.5 /100 | #254 | Tragic 31.0% |
| Belizeans | 0.5 /100 | #255 | Tragic 31.0% |
| Immigrants | West Indies | 0.4 /100 | #256 | Tragic 31.1% |
| Immigrants | Bahamas | 0.4 /100 | #257 | Tragic 31.1% |
| Immigrants | Caribbean | 0.4 /100 | #258 | Tragic 31.1% |
| Immigrants | Bangladesh | 0.4 /100 | #259 | Tragic 31.1% |
Demographics Similar to Immigrants from Uzbekistan by Single Mother Poverty
In terms of single mother poverty, the demographic groups most similar to Immigrants from Uzbekistan are South American Indian (29.3%, a difference of 0.030%), Immigrants from Norway (29.3%, a difference of 0.050%), Canadian (29.3%, a difference of 0.11%), Immigrants from Bosnia and Herzegovina (29.2%, a difference of 0.12%), and Immigrants from Eastern Africa (29.3%, a difference of 0.20%).
| Demographics | Rating | Rank | Single Mother Poverty |
| Carpatho Rusyns | 53.8 /100 | #172 | Average 29.1% |
| British | 50.6 /100 | #173 | Average 29.2% |
| Immigrants | Saudi Arabia | 50.0 /100 | #174 | Average 29.2% |
| Immigrants | Costa Rica | 48.8 /100 | #175 | Average 29.2% |
| Hawaiians | 47.8 /100 | #176 | Average 29.2% |
| Immigrants | Bosnia and Herzegovina | 45.1 /100 | #177 | Average 29.2% |
| South American Indians | 43.2 /100 | #178 | Average 29.3% |
| Immigrants | Uzbekistan | 42.6 /100 | #179 | Average 29.3% |
| Immigrants | Norway | 41.5 /100 | #180 | Average 29.3% |
| Canadians | 40.4 /100 | #181 | Average 29.3% |
| Immigrants | Eastern Africa | 38.5 /100 | #182 | Fair 29.3% |
| Nepalese | 38.3 /100 | #183 | Fair 29.3% |
| Nigerians | 38.0 /100 | #184 | Fair 29.3% |
| Ghanaians | 36.8 /100 | #185 | Fair 29.4% |
| Yugoslavians | 36.0 /100 | #186 | Fair 29.4% |