Immigrants from Dominica vs Immigrants from Uzbekistan Single Mother Poverty
COMPARE
Immigrants from Dominica
Immigrants from Uzbekistan
Single Mother Poverty
Single Mother Poverty Comparison
Immigrants from Dominica
Immigrants from Uzbekistan
32.5%
SINGLE MOTHER POVERTY
0.0/ 100
METRIC RATING
287th/ 347
METRIC RANK
29.3%
SINGLE MOTHER POVERTY
42.6/ 100
METRIC RATING
179th/ 347
METRIC RANK
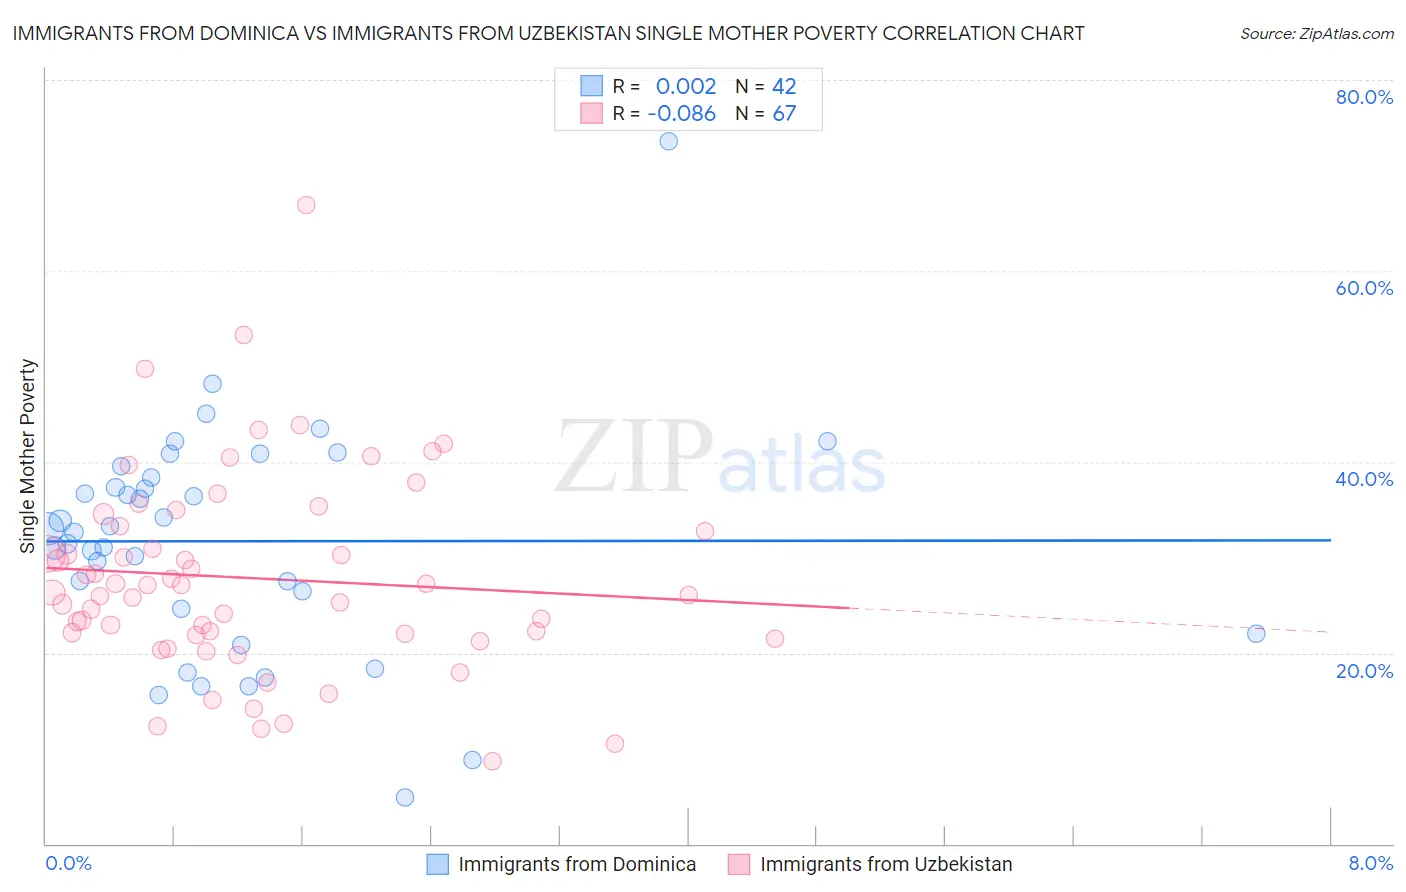
Immigrants from Dominica vs Immigrants from Uzbekistan Single Mother Poverty Correlation Chart
The statistical analysis conducted on geographies consisting of 83,555,072 people shows no correlation between the proportion of Immigrants from Dominica and poverty level among single mothers in the United States with a correlation coefficient (R) of 0.002 and weighted average of 32.5%. Similarly, the statistical analysis conducted on geographies consisting of 117,476,483 people shows a slight negative correlation between the proportion of Immigrants from Uzbekistan and poverty level among single mothers in the United States with a correlation coefficient (R) of -0.086 and weighted average of 29.3%, a difference of 11.0%.
Single Mother Poverty Correlation Summary
| Measurement | Immigrants from Dominica | Immigrants from Uzbekistan |
| Minimum | 4.9% | 8.7% |
| Maximum | 73.5% | 67.0% |
| Range | 68.7% | 58.3% |
| Mean | 31.7% | 27.8% |
| Median | 32.8% | 26.3% |
| Interquartile 25% (IQ1) | 24.6% | 21.9% |
| Interquartile 75% (IQ3) | 38.3% | 33.2% |
| Interquartile Range (IQR) | 13.7% | 11.3% |
| Standard Deviation (Sample) | 12.0% | 10.5% |
| Standard Deviation (Population) | 11.9% | 10.4% |
Similar Demographics by Single Mother Poverty
Demographics Similar to Immigrants from Dominica by Single Mother Poverty
In terms of single mother poverty, the demographic groups most similar to Immigrants from Dominica are Yup'ik (32.5%, a difference of 0.13%), Immigrants from Latin America (32.4%, a difference of 0.20%), Somali (32.6%, a difference of 0.23%), U.S. Virgin Islander (32.6%, a difference of 0.25%), and Indonesian (32.4%, a difference of 0.31%).
| Demographics | Rating | Rank | Single Mother Poverty |
| Immigrants | Nonimmigrants | 0.0 /100 | #280 | Tragic 32.2% |
| Cree | 0.0 /100 | #281 | Tragic 32.2% |
| Immigrants | Azores | 0.0 /100 | #282 | Tragic 32.2% |
| Spanish Americans | 0.0 /100 | #283 | Tragic 32.3% |
| Indonesians | 0.0 /100 | #284 | Tragic 32.4% |
| Immigrants | Latin America | 0.0 /100 | #285 | Tragic 32.4% |
| Yup'ik | 0.0 /100 | #286 | Tragic 32.5% |
| Immigrants | Dominica | 0.0 /100 | #287 | Tragic 32.5% |
| Somalis | 0.0 /100 | #288 | Tragic 32.6% |
| U.S. Virgin Islanders | 0.0 /100 | #289 | Tragic 32.6% |
| Osage | 0.0 /100 | #290 | Tragic 32.6% |
| Guatemalans | 0.0 /100 | #291 | Tragic 32.9% |
| Shoshone | 0.0 /100 | #292 | Tragic 32.9% |
| Aleuts | 0.0 /100 | #293 | Tragic 32.9% |
| French American Indians | 0.0 /100 | #294 | Tragic 33.1% |
Demographics Similar to Immigrants from Uzbekistan by Single Mother Poverty
In terms of single mother poverty, the demographic groups most similar to Immigrants from Uzbekistan are South American Indian (29.3%, a difference of 0.030%), Immigrants from Norway (29.3%, a difference of 0.050%), Canadian (29.3%, a difference of 0.11%), Immigrants from Bosnia and Herzegovina (29.2%, a difference of 0.12%), and Immigrants from Eastern Africa (29.3%, a difference of 0.20%).
| Demographics | Rating | Rank | Single Mother Poverty |
| Carpatho Rusyns | 53.8 /100 | #172 | Average 29.1% |
| British | 50.6 /100 | #173 | Average 29.2% |
| Immigrants | Saudi Arabia | 50.0 /100 | #174 | Average 29.2% |
| Immigrants | Costa Rica | 48.8 /100 | #175 | Average 29.2% |
| Hawaiians | 47.8 /100 | #176 | Average 29.2% |
| Immigrants | Bosnia and Herzegovina | 45.1 /100 | #177 | Average 29.2% |
| South American Indians | 43.2 /100 | #178 | Average 29.3% |
| Immigrants | Uzbekistan | 42.6 /100 | #179 | Average 29.3% |
| Immigrants | Norway | 41.5 /100 | #180 | Average 29.3% |
| Canadians | 40.4 /100 | #181 | Average 29.3% |
| Immigrants | Eastern Africa | 38.5 /100 | #182 | Fair 29.3% |
| Nepalese | 38.3 /100 | #183 | Fair 29.3% |
| Nigerians | 38.0 /100 | #184 | Fair 29.3% |
| Ghanaians | 36.8 /100 | #185 | Fair 29.4% |
| Yugoslavians | 36.0 /100 | #186 | Fair 29.4% |