Brazilian vs Immigrants from Russia Female Unemployment
COMPARE
Brazilian
Immigrants from Russia
Female Unemployment
Female Unemployment Comparison
Brazilians
Immigrants from Russia
5.5%
FEMALE UNEMPLOYMENT
7.3/ 100
METRIC RATING
221st/ 347
METRIC RANK
5.2%
FEMALE UNEMPLOYMENT
69.3/ 100
METRIC RATING
157th/ 347
METRIC RANK
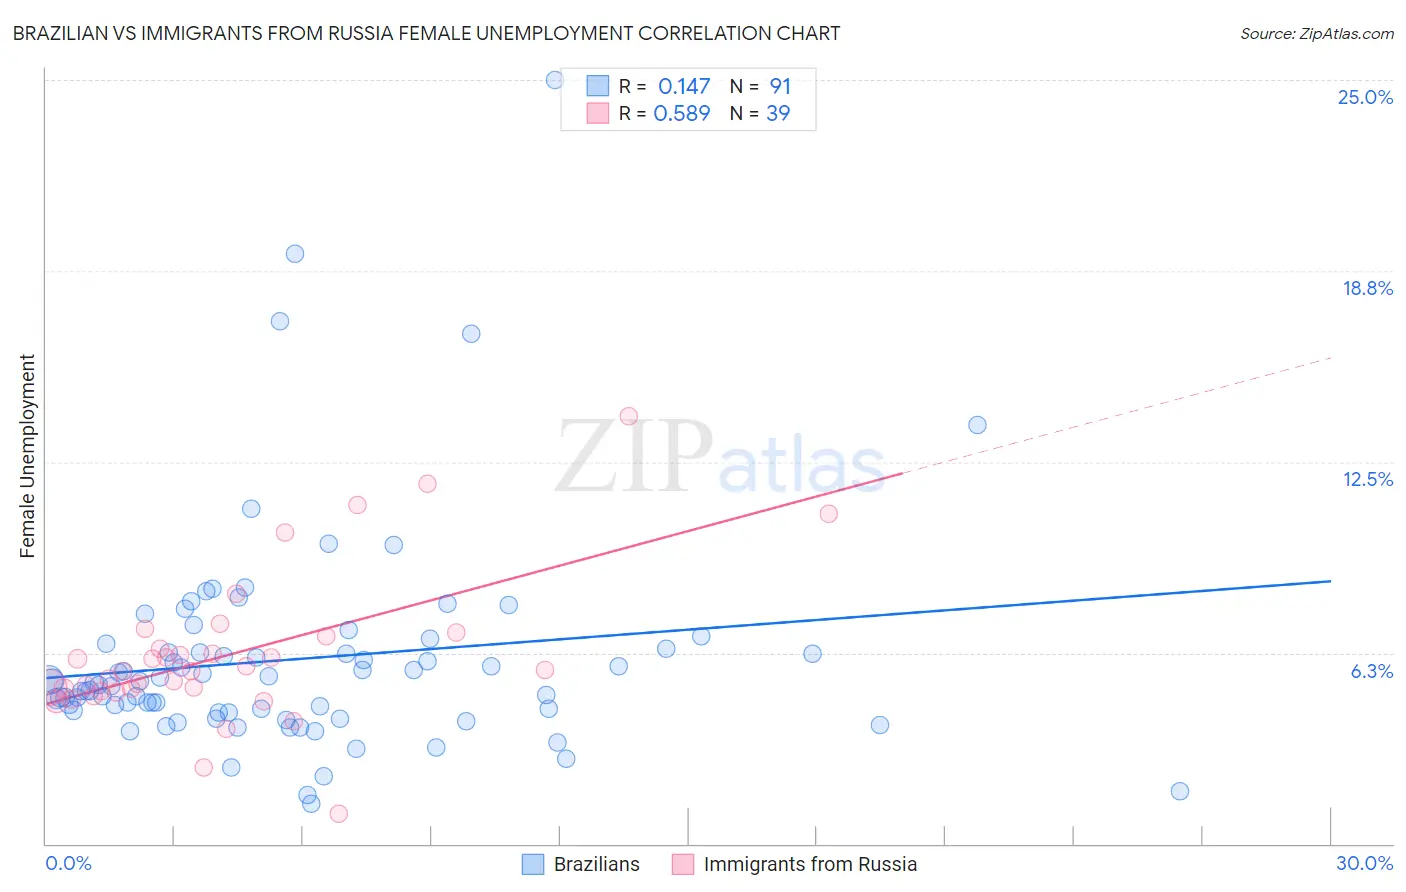
Brazilian vs Immigrants from Russia Female Unemployment Correlation Chart
The statistical analysis conducted on geographies consisting of 323,090,102 people shows a poor positive correlation between the proportion of Brazilians and unemploymnet rate among females in the United States with a correlation coefficient (R) of 0.147 and weighted average of 5.5%. Similarly, the statistical analysis conducted on geographies consisting of 346,554,510 people shows a substantial positive correlation between the proportion of Immigrants from Russia and unemploymnet rate among females in the United States with a correlation coefficient (R) of 0.589 and weighted average of 5.2%, a difference of 5.1%.
Female Unemployment Correlation Summary
| Measurement | Brazilian | Immigrants from Russia |
| Minimum | 1.3% | 1.0% |
| Maximum | 25.0% | 14.0% |
| Range | 23.7% | 13.0% |
| Mean | 6.0% | 6.2% |
| Median | 5.3% | 5.7% |
| Interquartile 25% (IQ1) | 4.3% | 5.0% |
| Interquartile 75% (IQ3) | 6.4% | 6.8% |
| Interquartile Range (IQR) | 2.1% | 1.8% |
| Standard Deviation (Sample) | 3.6% | 2.5% |
| Standard Deviation (Population) | 3.6% | 2.4% |
Similar Demographics by Female Unemployment
Demographics Similar to Brazilians by Female Unemployment
In terms of female unemployment, the demographic groups most similar to Brazilians are Nicaraguan (5.5%, a difference of 0.020%), Delaware (5.5%, a difference of 0.030%), Iraqi (5.5%, a difference of 0.060%), Immigrants from Africa (5.4%, a difference of 0.25%), and South American (5.4%, a difference of 0.26%).
| Demographics | Rating | Rank | Female Unemployment |
| Seminole | 10.3 /100 | #214 | Poor 5.4% |
| Immigrants | Nicaragua | 10.2 /100 | #215 | Poor 5.4% |
| Comanche | 10.0 /100 | #216 | Poor 5.4% |
| Peruvians | 9.6 /100 | #217 | Tragic 5.4% |
| Bermudans | 9.0 /100 | #218 | Tragic 5.4% |
| South Americans | 8.6 /100 | #219 | Tragic 5.4% |
| Immigrants | Africa | 8.5 /100 | #220 | Tragic 5.4% |
| Brazilians | 7.3 /100 | #221 | Tragic 5.5% |
| Nicaraguans | 7.2 /100 | #222 | Tragic 5.5% |
| Delaware | 7.2 /100 | #223 | Tragic 5.5% |
| Iraqis | 7.1 /100 | #224 | Tragic 5.5% |
| French American Indians | 6.1 /100 | #225 | Tragic 5.5% |
| Immigrants | Peru | 5.9 /100 | #226 | Tragic 5.5% |
| Immigrants | Philippines | 5.3 /100 | #227 | Tragic 5.5% |
| Israelis | 4.8 /100 | #228 | Tragic 5.5% |
Demographics Similar to Immigrants from Russia by Female Unemployment
In terms of female unemployment, the demographic groups most similar to Immigrants from Russia are Immigrants from Northern Africa (5.2%, a difference of 0.020%), Immigrants from Egypt (5.2%, a difference of 0.050%), Albanian (5.2%, a difference of 0.070%), South African (5.2%, a difference of 0.10%), and Immigrants from Micronesia (5.2%, a difference of 0.17%).
| Demographics | Rating | Rank | Female Unemployment |
| Egyptians | 78.3 /100 | #150 | Good 5.2% |
| Immigrants | China | 75.9 /100 | #151 | Good 5.2% |
| Immigrants | Italy | 75.0 /100 | #152 | Good 5.2% |
| Immigrants | Greece | 74.9 /100 | #153 | Good 5.2% |
| South Africans | 70.8 /100 | #154 | Good 5.2% |
| Immigrants | Egypt | 70.0 /100 | #155 | Good 5.2% |
| Immigrants | Northern Africa | 69.6 /100 | #156 | Good 5.2% |
| Immigrants | Russia | 69.3 /100 | #157 | Good 5.2% |
| Albanians | 68.3 /100 | #158 | Good 5.2% |
| Immigrants | Micronesia | 66.9 /100 | #159 | Good 5.2% |
| Immigrants | Spain | 66.8 /100 | #160 | Good 5.2% |
| Immigrants | Pakistan | 66.7 /100 | #161 | Good 5.2% |
| Potawatomi | 65.9 /100 | #162 | Good 5.2% |
| Immigrants | Asia | 64.3 /100 | #163 | Good 5.2% |
| Bangladeshis | 64.3 /100 | #164 | Good 5.2% |