Potawatomi vs Immigrants from Russia Male Poverty
COMPARE
Potawatomi
Immigrants from Russia
Male Poverty
Male Poverty Comparison
Potawatomi
Immigrants from Russia
12.9%
MALE POVERTY
0.2/ 100
METRIC RATING
249th/ 347
METRIC RANK
10.6%
MALE POVERTY
88.6/ 100
METRIC RATING
115th/ 347
METRIC RANK
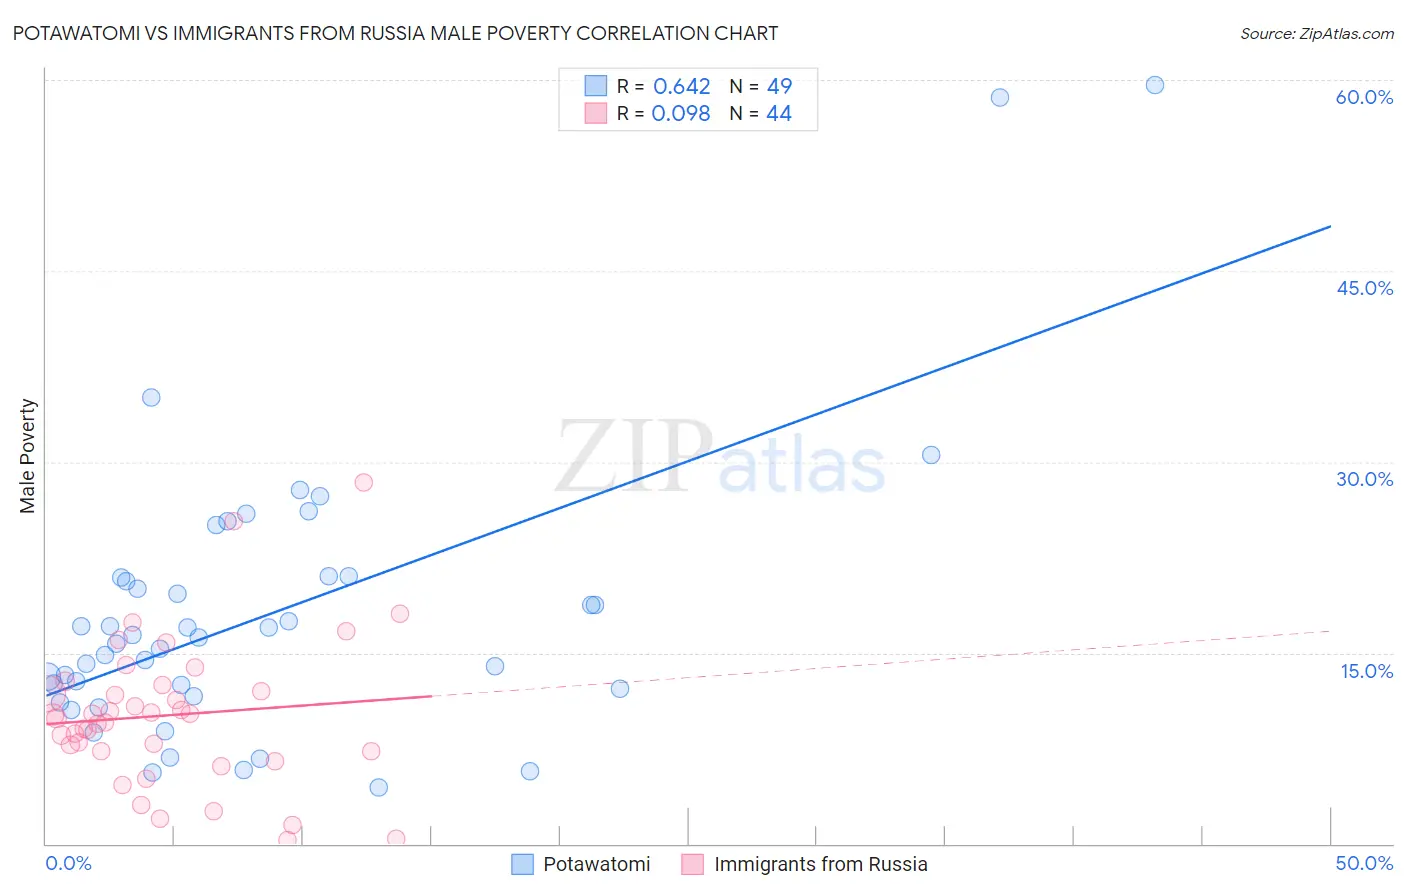
Potawatomi vs Immigrants from Russia Male Poverty Correlation Chart
The statistical analysis conducted on geographies consisting of 117,745,310 people shows a significant positive correlation between the proportion of Potawatomi and poverty level among males in the United States with a correlation coefficient (R) of 0.642 and weighted average of 12.9%. Similarly, the statistical analysis conducted on geographies consisting of 347,573,177 people shows a slight positive correlation between the proportion of Immigrants from Russia and poverty level among males in the United States with a correlation coefficient (R) of 0.098 and weighted average of 10.6%, a difference of 21.4%.
Male Poverty Correlation Summary
| Measurement | Potawatomi | Immigrants from Russia |
| Minimum | 4.4% | 0.34% |
| Maximum | 59.6% | 28.4% |
| Range | 55.1% | 28.0% |
| Mean | 18.0% | 10.1% |
| Median | 16.2% | 10.0% |
| Interquartile 25% (IQ1) | 11.9% | 7.2% |
| Interquartile 75% (IQ3) | 21.0% | 12.2% |
| Interquartile Range (IQR) | 9.1% | 5.0% |
| Standard Deviation (Sample) | 11.0% | 5.7% |
| Standard Deviation (Population) | 10.9% | 5.7% |
Similar Demographics by Male Poverty
Demographics Similar to Potawatomi by Male Poverty
In terms of male poverty, the demographic groups most similar to Potawatomi are Immigrants from Nicaragua (12.9%, a difference of 0.010%), Immigrants from Sudan (12.9%, a difference of 0.070%), Immigrants from Cuba (12.9%, a difference of 0.11%), Immigrants from Western Africa (12.9%, a difference of 0.13%), and Immigrants from Ecuador (12.9%, a difference of 0.14%).
| Demographics | Rating | Rank | Male Poverty |
| Nepalese | 0.3 /100 | #242 | Tragic 12.8% |
| Alaskan Athabascans | 0.3 /100 | #243 | Tragic 12.8% |
| Tsimshian | 0.3 /100 | #244 | Tragic 12.8% |
| Liberians | 0.3 /100 | #245 | Tragic 12.8% |
| Immigrants | El Salvador | 0.2 /100 | #246 | Tragic 12.8% |
| Immigrants | Western Africa | 0.2 /100 | #247 | Tragic 12.9% |
| Immigrants | Sudan | 0.2 /100 | #248 | Tragic 12.9% |
| Potawatomi | 0.2 /100 | #249 | Tragic 12.9% |
| Immigrants | Nicaragua | 0.2 /100 | #250 | Tragic 12.9% |
| Immigrants | Cuba | 0.2 /100 | #251 | Tragic 12.9% |
| Immigrants | Ecuador | 0.2 /100 | #252 | Tragic 12.9% |
| Immigrants | Ghana | 0.2 /100 | #253 | Tragic 12.9% |
| Mexican American Indians | 0.1 /100 | #254 | Tragic 13.0% |
| Immigrants | Liberia | 0.1 /100 | #255 | Tragic 13.0% |
| Immigrants | Burma/Myanmar | 0.1 /100 | #256 | Tragic 13.0% |
Demographics Similar to Immigrants from Russia by Male Poverty
In terms of male poverty, the demographic groups most similar to Immigrants from Russia are Sri Lankan (10.6%, a difference of 0.11%), Immigrants from Brazil (10.6%, a difference of 0.12%), Immigrants from South Eastern Asia (10.6%, a difference of 0.13%), Palestinian (10.6%, a difference of 0.14%), and Immigrants from Turkey (10.6%, a difference of 0.24%).
| Demographics | Rating | Rank | Male Poverty |
| Portuguese | 91.0 /100 | #108 | Exceptional 10.6% |
| Albanians | 90.6 /100 | #109 | Exceptional 10.6% |
| Argentineans | 90.1 /100 | #110 | Exceptional 10.6% |
| Immigrants | Argentina | 89.8 /100 | #111 | Excellent 10.6% |
| Immigrants | Turkey | 89.5 /100 | #112 | Excellent 10.6% |
| Palestinians | 89.1 /100 | #113 | Excellent 10.6% |
| Immigrants | Brazil | 89.0 /100 | #114 | Excellent 10.6% |
| Immigrants | Russia | 88.6 /100 | #115 | Excellent 10.6% |
| Sri Lankans | 88.1 /100 | #116 | Excellent 10.6% |
| Immigrants | South Eastern Asia | 88.1 /100 | #117 | Excellent 10.6% |
| Okinawans | 87.6 /100 | #118 | Excellent 10.7% |
| Immigrants | Hungary | 87.6 /100 | #119 | Excellent 10.7% |
| Immigrants | China | 87.1 /100 | #120 | Excellent 10.7% |
| Peruvians | 87.1 /100 | #121 | Excellent 10.7% |
| Native Hawaiians | 87.0 /100 | #122 | Excellent 10.7% |