Bolivian vs Luxembourger Family Poverty
COMPARE
Bolivian
Luxembourger
Family Poverty
Family Poverty Comparison
Bolivians
Luxembourgers
7.5%
FAMILY POVERTY
99.3/ 100
METRIC RATING
38th/ 347
METRIC RANK
7.2%
FAMILY POVERTY
99.8/ 100
METRIC RATING
17th/ 347
METRIC RANK
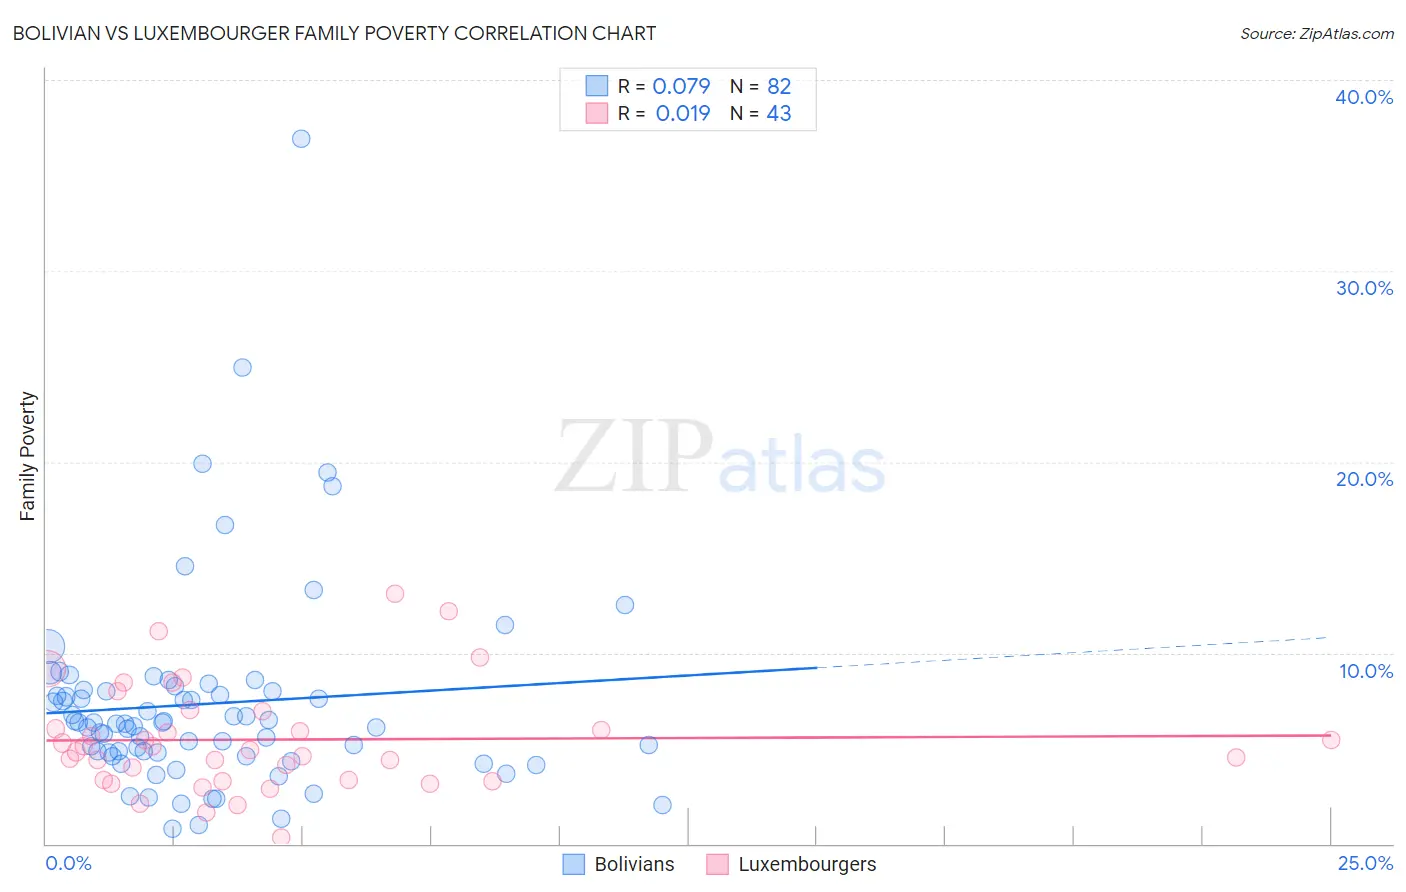
Bolivian vs Luxembourger Family Poverty Correlation Chart
The statistical analysis conducted on geographies consisting of 184,453,114 people shows a slight positive correlation between the proportion of Bolivians and poverty level among families in the United States with a correlation coefficient (R) of 0.079 and weighted average of 7.5%. Similarly, the statistical analysis conducted on geographies consisting of 144,473,448 people shows no correlation between the proportion of Luxembourgers and poverty level among families in the United States with a correlation coefficient (R) of 0.019 and weighted average of 7.2%, a difference of 4.4%.
Family Poverty Correlation Summary
| Measurement | Bolivian | Luxembourger |
| Minimum | 0.79% | 0.32% |
| Maximum | 36.9% | 13.1% |
| Range | 36.2% | 12.7% |
| Mean | 7.3% | 5.5% |
| Median | 6.3% | 4.9% |
| Interquartile 25% (IQ1) | 4.8% | 3.4% |
| Interquartile 75% (IQ3) | 8.0% | 7.0% |
| Interquartile Range (IQR) | 3.2% | 3.6% |
| Standard Deviation (Sample) | 5.4% | 2.8% |
| Standard Deviation (Population) | 5.4% | 2.8% |
Similar Demographics by Family Poverty
Demographics Similar to Bolivians by Family Poverty
In terms of family poverty, the demographic groups most similar to Bolivians are Carpatho Rusyn (7.5%, a difference of 0.060%), Slovene (7.5%, a difference of 0.10%), Estonian (7.5%, a difference of 0.24%), Immigrants from Australia (7.6%, a difference of 0.40%), and Turkish (7.5%, a difference of 0.41%).
| Demographics | Rating | Rank | Family Poverty |
| Czechs | 99.6 /100 | #31 | Exceptional 7.4% |
| Poles | 99.5 /100 | #32 | Exceptional 7.4% |
| Immigrants | Japan | 99.5 /100 | #33 | Exceptional 7.4% |
| Russians | 99.5 /100 | #34 | Exceptional 7.5% |
| Greeks | 99.4 /100 | #35 | Exceptional 7.5% |
| Turks | 99.4 /100 | #36 | Exceptional 7.5% |
| Estonians | 99.4 /100 | #37 | Exceptional 7.5% |
| Bolivians | 99.3 /100 | #38 | Exceptional 7.5% |
| Carpatho Rusyns | 99.3 /100 | #39 | Exceptional 7.5% |
| Slovenes | 99.3 /100 | #40 | Exceptional 7.5% |
| Immigrants | Australia | 99.2 /100 | #41 | Exceptional 7.6% |
| Scandinavians | 99.1 /100 | #42 | Exceptional 7.6% |
| Immigrants | Austria | 99.1 /100 | #43 | Exceptional 7.6% |
| Germans | 99.0 /100 | #44 | Exceptional 7.7% |
| Okinawans | 98.9 /100 | #45 | Exceptional 7.7% |
Demographics Similar to Luxembourgers by Family Poverty
In terms of family poverty, the demographic groups most similar to Luxembourgers are Immigrants from Lithuania (7.2%, a difference of 0.010%), Immigrants from South Central Asia (7.2%, a difference of 0.22%), Eastern European (7.2%, a difference of 0.31%), Immigrants from Hong Kong (7.3%, a difference of 0.48%), and Lithuanian (7.2%, a difference of 0.50%).
| Demographics | Rating | Rank | Family Poverty |
| Bulgarians | 99.8 /100 | #10 | Exceptional 7.1% |
| Immigrants | Singapore | 99.8 /100 | #11 | Exceptional 7.1% |
| Maltese | 99.8 /100 | #12 | Exceptional 7.1% |
| Swedes | 99.8 /100 | #13 | Exceptional 7.1% |
| Iranians | 99.8 /100 | #14 | Exceptional 7.1% |
| Lithuanians | 99.8 /100 | #15 | Exceptional 7.2% |
| Immigrants | South Central Asia | 99.8 /100 | #16 | Exceptional 7.2% |
| Luxembourgers | 99.8 /100 | #17 | Exceptional 7.2% |
| Immigrants | Lithuania | 99.8 /100 | #18 | Exceptional 7.2% |
| Eastern Europeans | 99.7 /100 | #19 | Exceptional 7.2% |
| Immigrants | Hong Kong | 99.7 /100 | #20 | Exceptional 7.3% |
| Immigrants | Iran | 99.7 /100 | #21 | Exceptional 7.3% |
| Danes | 99.7 /100 | #22 | Exceptional 7.3% |
| Assyrians/Chaldeans/Syriacs | 99.7 /100 | #23 | Exceptional 7.3% |
| Croatians | 99.7 /100 | #24 | Exceptional 7.3% |