Black/African American vs Immigrants from Vietnam 2nd Grade
COMPARE
Black/African American
Immigrants from Vietnam
2nd Grade
2nd Grade Comparison
Blacks/African Americans
Immigrants from Vietnam
97.8%
2ND GRADE
29.9/ 100
METRIC RATING
192nd/ 347
METRIC RANK
96.5%
2ND GRADE
0.0/ 100
METRIC RATING
327th/ 347
METRIC RANK
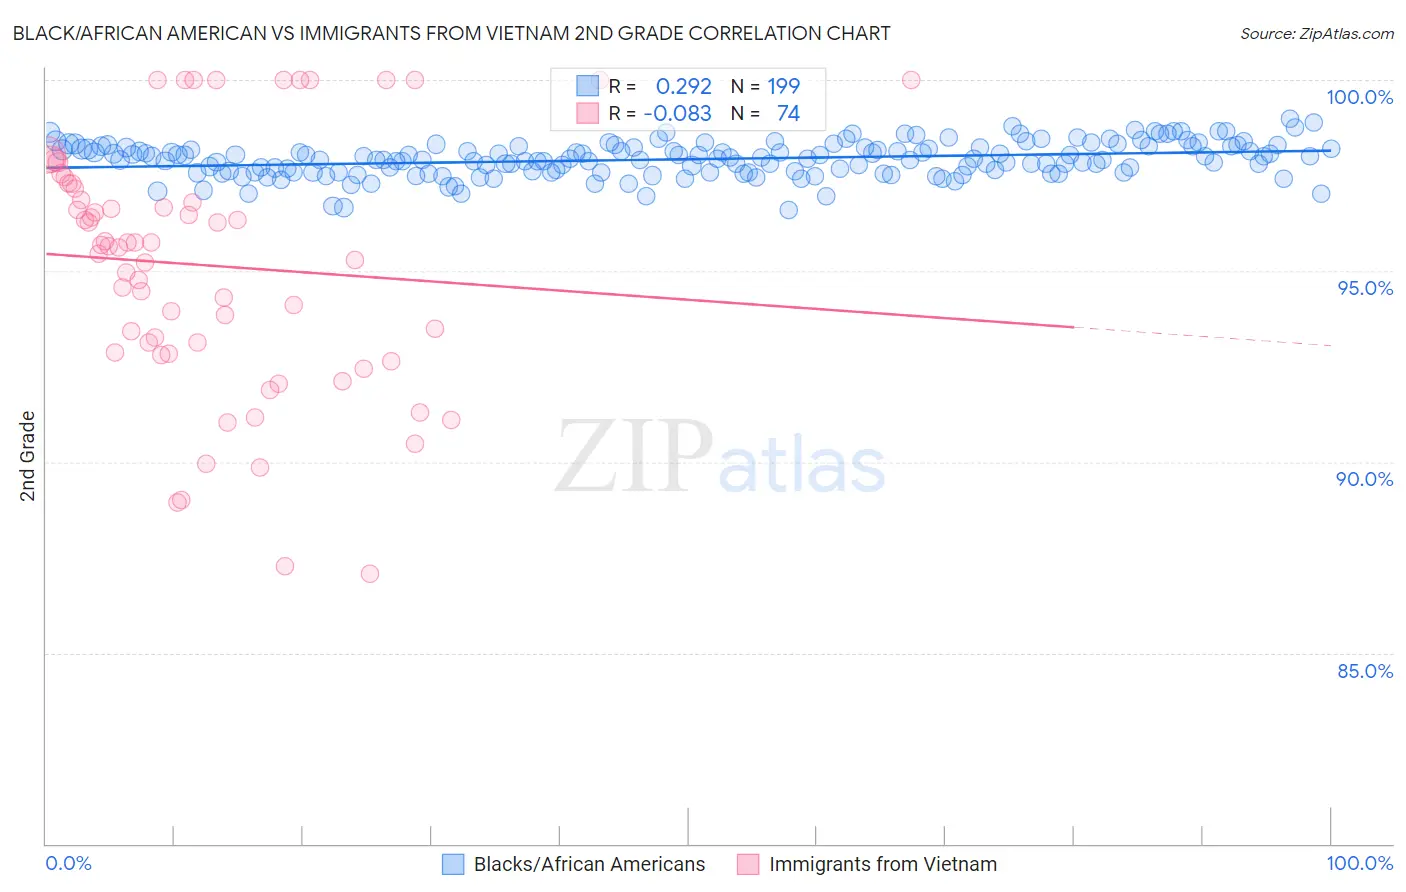
Black/African American vs Immigrants from Vietnam 2nd Grade Correlation Chart
The statistical analysis conducted on geographies consisting of 566,043,750 people shows a weak positive correlation between the proportion of Blacks/African Americans and percentage of population with at least 2nd grade education in the United States with a correlation coefficient (R) of 0.292 and weighted average of 97.8%. Similarly, the statistical analysis conducted on geographies consisting of 404,844,130 people shows a slight negative correlation between the proportion of Immigrants from Vietnam and percentage of population with at least 2nd grade education in the United States with a correlation coefficient (R) of -0.083 and weighted average of 96.5%, a difference of 1.3%.
2nd Grade Correlation Summary
| Measurement | Black/African American | Immigrants from Vietnam |
| Minimum | 96.6% | 87.1% |
| Maximum | 99.0% | 100.0% |
| Range | 2.4% | 12.9% |
| Mean | 97.9% | 95.1% |
| Median | 97.9% | 95.7% |
| Interquartile 25% (IQ1) | 97.6% | 92.9% |
| Interquartile 75% (IQ3) | 98.2% | 97.3% |
| Interquartile Range (IQR) | 0.66% | 4.4% |
| Standard Deviation (Sample) | 0.44% | 3.2% |
| Standard Deviation (Population) | 0.44% | 3.2% |
Similar Demographics by 2nd Grade
Demographics Similar to Blacks/African Americans by 2nd Grade
In terms of 2nd grade, the demographic groups most similar to Blacks/African Americans are Paraguayan (97.8%, a difference of 0.0%), Panamanian (97.8%, a difference of 0.010%), Immigrants from Taiwan (97.8%, a difference of 0.010%), Hawaiian (97.8%, a difference of 0.010%), and Paiute (97.8%, a difference of 0.010%).
| Demographics | Rating | Rank | 2nd Grade |
| Immigrants | Argentina | 40.6 /100 | #185 | Average 97.8% |
| Arabs | 36.9 /100 | #186 | Fair 97.8% |
| Pakistanis | 36.1 /100 | #187 | Fair 97.8% |
| Immigrants | Kazakhstan | 35.6 /100 | #188 | Fair 97.8% |
| Panamanians | 33.5 /100 | #189 | Fair 97.8% |
| Immigrants | Taiwan | 31.8 /100 | #190 | Fair 97.8% |
| Paraguayans | 30.8 /100 | #191 | Fair 97.8% |
| Blacks/African Americans | 29.9 /100 | #192 | Fair 97.8% |
| Hawaiians | 28.5 /100 | #193 | Fair 97.8% |
| Paiute | 27.0 /100 | #194 | Fair 97.8% |
| Mongolians | 26.7 /100 | #195 | Fair 97.8% |
| Immigrants | Kenya | 26.4 /100 | #196 | Fair 97.8% |
| Immigrants | Uganda | 26.3 /100 | #197 | Fair 97.8% |
| Guamanians/Chamorros | 25.7 /100 | #198 | Fair 97.8% |
| Immigrants | Egypt | 24.4 /100 | #199 | Fair 97.8% |
Demographics Similar to Immigrants from Vietnam by 2nd Grade
In terms of 2nd grade, the demographic groups most similar to Immigrants from Vietnam are Mexican (96.5%, a difference of 0.0%), Japanese (96.5%, a difference of 0.010%), Immigrants from Latin America (96.5%, a difference of 0.010%), Immigrants from Armenia (96.5%, a difference of 0.050%), and Bangladeshi (96.5%, a difference of 0.060%).
| Demographics | Rating | Rank | 2nd Grade |
| Immigrants | Guyana | 0.0 /100 | #320 | Tragic 96.7% |
| Immigrants | Burma/Myanmar | 0.0 /100 | #321 | Tragic 96.7% |
| Immigrants | Bangladesh | 0.0 /100 | #322 | Tragic 96.7% |
| Vietnamese | 0.0 /100 | #323 | Tragic 96.7% |
| Mexican American Indians | 0.0 /100 | #324 | Tragic 96.7% |
| Dominicans | 0.0 /100 | #325 | Tragic 96.6% |
| Immigrants | Honduras | 0.0 /100 | #326 | Tragic 96.6% |
| Immigrants | Vietnam | 0.0 /100 | #327 | Tragic 96.5% |
| Mexicans | 0.0 /100 | #328 | Tragic 96.5% |
| Japanese | 0.0 /100 | #329 | Tragic 96.5% |
| Immigrants | Latin America | 0.0 /100 | #330 | Tragic 96.5% |
| Immigrants | Armenia | 0.0 /100 | #331 | Tragic 96.5% |
| Bangladeshis | 0.0 /100 | #332 | Tragic 96.5% |
| Immigrants | Dominican Republic | 0.0 /100 | #333 | Tragic 96.4% |
| Central Americans | 0.0 /100 | #334 | Tragic 96.4% |