Black/African American vs Indian (Asian) Female Poverty
COMPARE
Black/African American
Indian (Asian)
Female Poverty
Female Poverty Comparison
Blacks/African Americans
Indians (Asian)
18.6%
FEMALE POVERTY
0.0/ 100
METRIC RATING
328th/ 347
METRIC RANK
12.2%
FEMALE POVERTY
97.9/ 100
METRIC RATING
65th/ 347
METRIC RANK
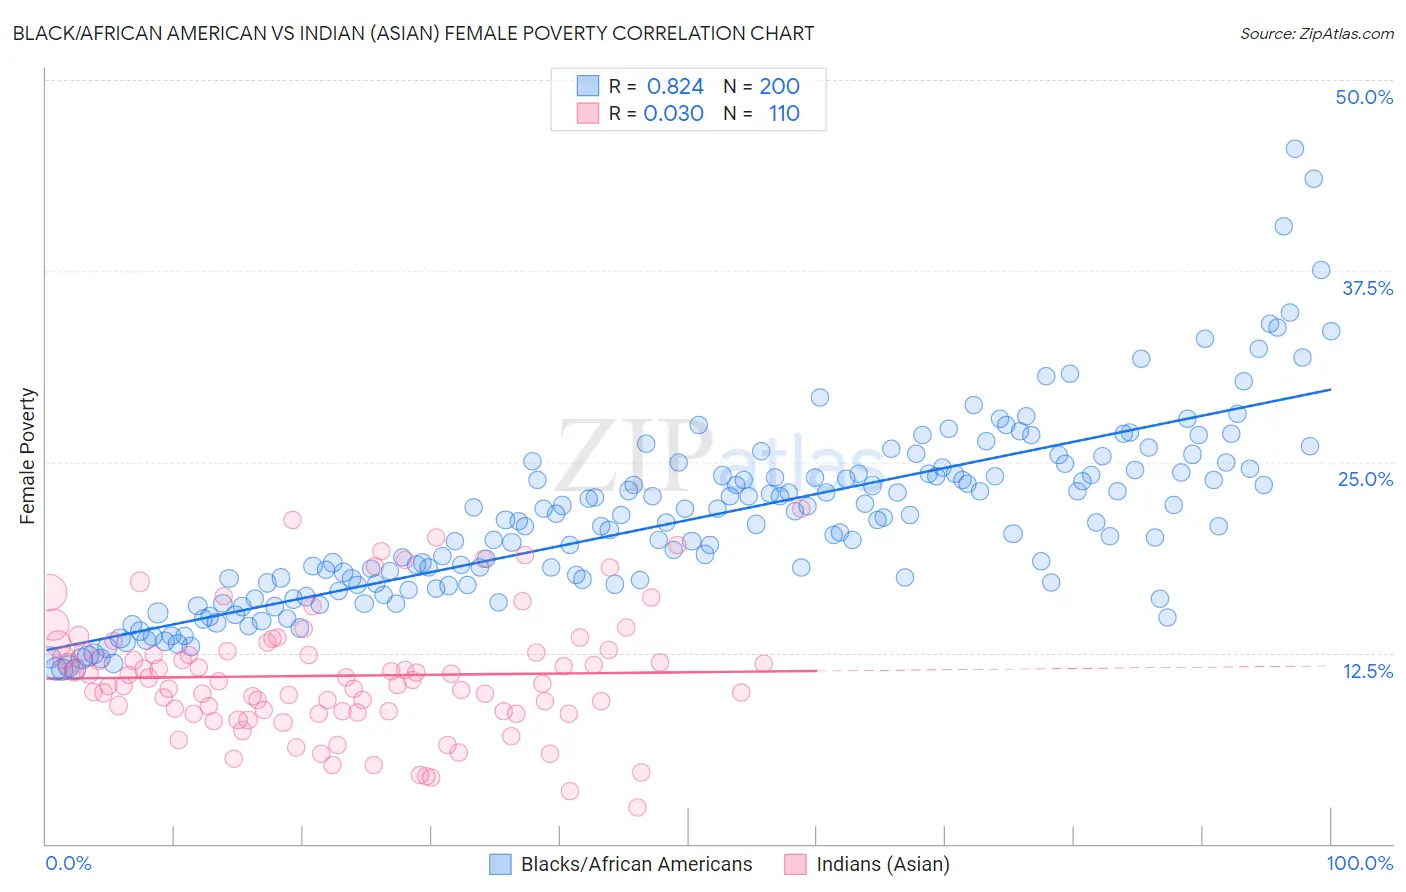
Black/African American vs Indian (Asian) Female Poverty Correlation Chart
The statistical analysis conducted on geographies consisting of 564,914,608 people shows a very strong positive correlation between the proportion of Blacks/African Americans and poverty level among females in the United States with a correlation coefficient (R) of 0.824 and weighted average of 18.6%. Similarly, the statistical analysis conducted on geographies consisting of 494,574,283 people shows no correlation between the proportion of Indians (Asian) and poverty level among females in the United States with a correlation coefficient (R) of 0.030 and weighted average of 12.2%, a difference of 52.4%.
Female Poverty Correlation Summary
| Measurement | Black/African American | Indian (Asian) |
| Minimum | 11.4% | 2.4% |
| Maximum | 45.5% | 21.9% |
| Range | 34.1% | 19.5% |
| Mean | 21.2% | 11.0% |
| Median | 21.0% | 10.7% |
| Interquartile 25% (IQ1) | 16.9% | 8.7% |
| Interquartile 75% (IQ3) | 24.2% | 12.6% |
| Interquartile Range (IQR) | 7.3% | 3.9% |
| Standard Deviation (Sample) | 6.0% | 3.9% |
| Standard Deviation (Population) | 6.0% | 3.9% |
Similar Demographics by Female Poverty
Demographics Similar to Blacks/African Americans by Female Poverty
In terms of female poverty, the demographic groups most similar to Blacks/African Americans are Kiowa (18.6%, a difference of 0.12%), Dominican (19.1%, a difference of 2.9%), Yakama (18.0%, a difference of 3.0%), Central American Indian (18.0%, a difference of 3.1%), and Native/Alaskan (19.2%, a difference of 3.3%).
| Demographics | Rating | Rank | Female Poverty |
| Arapaho | 0.0 /100 | #321 | Tragic 17.5% |
| Menominee | 0.0 /100 | #322 | Tragic 17.6% |
| Paiute | 0.0 /100 | #323 | Tragic 17.7% |
| Immigrants | Honduras | 0.0 /100 | #324 | Tragic 17.7% |
| Colville | 0.0 /100 | #325 | Tragic 17.8% |
| Central American Indians | 0.0 /100 | #326 | Tragic 18.0% |
| Yakama | 0.0 /100 | #327 | Tragic 18.0% |
| Blacks/African Americans | 0.0 /100 | #328 | Tragic 18.6% |
| Kiowa | 0.0 /100 | #329 | Tragic 18.6% |
| Dominicans | 0.0 /100 | #330 | Tragic 19.1% |
| Natives/Alaskans | 0.0 /100 | #331 | Tragic 19.2% |
| Apache | 0.0 /100 | #332 | Tragic 19.2% |
| Immigrants | Dominican Republic | 0.0 /100 | #333 | Tragic 19.3% |
| Houma | 0.0 /100 | #334 | Tragic 20.0% |
| Cheyenne | 0.0 /100 | #335 | Tragic 20.2% |
Demographics Similar to Indians (Asian) by Female Poverty
In terms of female poverty, the demographic groups most similar to Indians (Asian) are Austrian (12.2%, a difference of 0.010%), German (12.2%, a difference of 0.030%), Ukrainian (12.2%, a difference of 0.060%), Immigrants from Italy (12.2%, a difference of 0.14%), and Immigrants from Eastern Asia (12.2%, a difference of 0.14%).
| Demographics | Rating | Rank | Female Poverty |
| Scandinavians | 98.2 /100 | #58 | Exceptional 12.1% |
| Immigrants | Europe | 98.2 /100 | #59 | Exceptional 12.1% |
| Immigrants | Australia | 98.1 /100 | #60 | Exceptional 12.2% |
| Immigrants | Asia | 98.1 /100 | #61 | Exceptional 12.2% |
| Immigrants | Italy | 98.0 /100 | #62 | Exceptional 12.2% |
| Ukrainians | 98.0 /100 | #63 | Exceptional 12.2% |
| Germans | 98.0 /100 | #64 | Exceptional 12.2% |
| Indians (Asian) | 97.9 /100 | #65 | Exceptional 12.2% |
| Austrians | 97.9 /100 | #66 | Exceptional 12.2% |
| Immigrants | Eastern Asia | 97.8 /100 | #67 | Exceptional 12.2% |
| Immigrants | Netherlands | 97.8 /100 | #68 | Exceptional 12.2% |
| Swiss | 97.7 /100 | #69 | Exceptional 12.2% |
| Immigrants | Belgium | 97.7 /100 | #70 | Exceptional 12.2% |
| Carpatho Rusyns | 97.6 /100 | #71 | Exceptional 12.2% |
| Cambodians | 97.5 /100 | #72 | Exceptional 12.2% |