Belgian vs Welsh Single Female Poverty
COMPARE
Belgian
Welsh
Single Female Poverty
Single Female Poverty Comparison
Belgians
Welsh
21.5%
SINGLE FEMALE POVERTY
16.1/ 100
METRIC RATING
206th/ 347
METRIC RANK
22.0%
SINGLE FEMALE POVERTY
5.0/ 100
METRIC RATING
231st/ 347
METRIC RANK
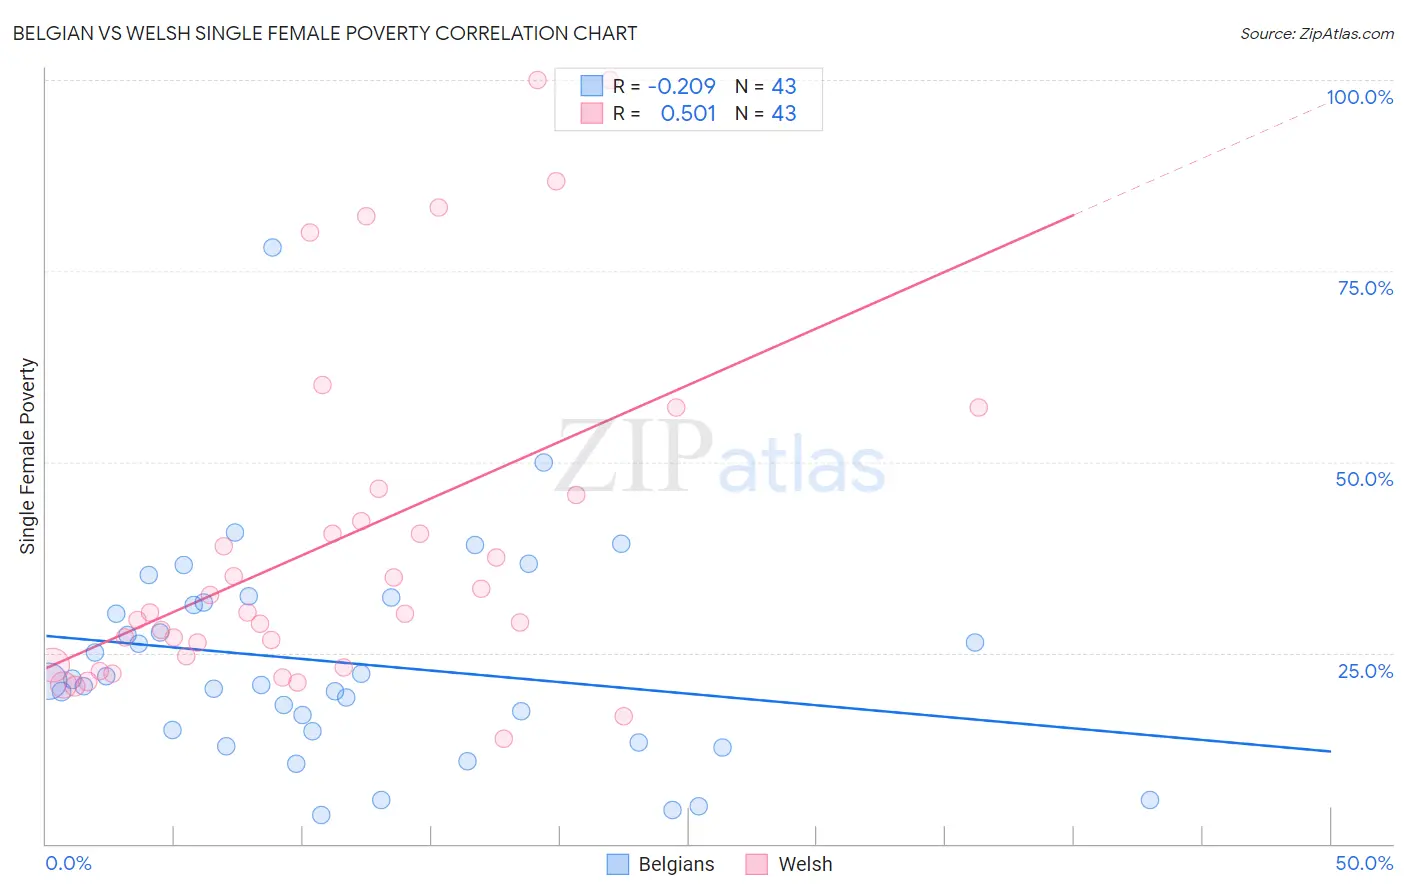
Belgian vs Welsh Single Female Poverty Correlation Chart
The statistical analysis conducted on geographies consisting of 349,903,575 people shows a weak negative correlation between the proportion of Belgians and poverty level among single females in the United States with a correlation coefficient (R) of -0.209 and weighted average of 21.5%. Similarly, the statistical analysis conducted on geographies consisting of 513,029,164 people shows a substantial positive correlation between the proportion of Welsh and poverty level among single females in the United States with a correlation coefficient (R) of 0.501 and weighted average of 22.0%, a difference of 2.0%.
Single Female Poverty Correlation Summary
| Measurement | Belgian | Welsh |
| Minimum | 3.8% | 13.7% |
| Maximum | 78.0% | 100.0% |
| Range | 74.2% | 86.3% |
| Mean | 23.7% | 39.5% |
| Median | 21.2% | 30.2% |
| Interquartile 25% (IQ1) | 14.8% | 23.5% |
| Interquartile 75% (IQ3) | 31.6% | 45.7% |
| Interquartile Range (IQR) | 16.8% | 22.3% |
| Standard Deviation (Sample) | 13.9% | 22.8% |
| Standard Deviation (Population) | 13.7% | 22.5% |
Similar Demographics by Single Female Poverty
Demographics Similar to Belgians by Single Female Poverty
In terms of single female poverty, the demographic groups most similar to Belgians are Finnish (21.5%, a difference of 0.020%), Ghanaian (21.6%, a difference of 0.040%), Immigrants from Africa (21.5%, a difference of 0.070%), Haitian (21.6%, a difference of 0.070%), and Immigrants from Eastern Africa (21.6%, a difference of 0.11%).
| Demographics | Rating | Rank | Single Female Poverty |
| Immigrants | Immigrants | 22.0 /100 | #199 | Fair 21.4% |
| Irish | 21.4 /100 | #200 | Fair 21.4% |
| Nigerians | 20.9 /100 | #201 | Fair 21.4% |
| Immigrants | Kenya | 20.7 /100 | #202 | Fair 21.4% |
| Immigrants | Haiti | 18.8 /100 | #203 | Poor 21.5% |
| Immigrants | Africa | 16.7 /100 | #204 | Poor 21.5% |
| Finns | 16.2 /100 | #205 | Poor 21.5% |
| Belgians | 16.1 /100 | #206 | Poor 21.5% |
| Ghanaians | 15.7 /100 | #207 | Poor 21.6% |
| Haitians | 15.4 /100 | #208 | Poor 21.6% |
| Immigrants | Eastern Africa | 15.1 /100 | #209 | Poor 21.6% |
| Immigrants | Panama | 14.4 /100 | #210 | Poor 21.6% |
| Icelanders | 14.0 /100 | #211 | Poor 21.6% |
| Jamaicans | 14.0 /100 | #212 | Poor 21.6% |
| Guamanians/Chamorros | 13.7 /100 | #213 | Poor 21.6% |
Demographics Similar to Welsh by Single Female Poverty
In terms of single female poverty, the demographic groups most similar to Welsh are Immigrants from Thailand (22.0%, a difference of 0.010%), Immigrants from Western Africa (22.0%, a difference of 0.090%), Tlingit-Haida (21.9%, a difference of 0.11%), Spaniard (22.0%, a difference of 0.11%), and Spanish (22.0%, a difference of 0.11%).
| Demographics | Rating | Rank | Single Female Poverty |
| Barbadians | 7.2 /100 | #224 | Tragic 21.8% |
| English | 6.4 /100 | #225 | Tragic 21.9% |
| Immigrants | Portugal | 5.8 /100 | #226 | Tragic 21.9% |
| Immigrants | Ghana | 5.8 /100 | #227 | Tragic 21.9% |
| Salvadorans | 5.5 /100 | #228 | Tragic 21.9% |
| Tlingit-Haida | 5.4 /100 | #229 | Tragic 21.9% |
| Immigrants | Western Africa | 5.3 /100 | #230 | Tragic 22.0% |
| Welsh | 5.0 /100 | #231 | Tragic 22.0% |
| Immigrants | Thailand | 5.0 /100 | #232 | Tragic 22.0% |
| Spaniards | 4.7 /100 | #233 | Tragic 22.0% |
| Spanish | 4.7 /100 | #234 | Tragic 22.0% |
| Dutch | 4.6 /100 | #235 | Tragic 22.0% |
| Immigrants | Ecuador | 4.2 /100 | #236 | Tragic 22.0% |
| Vietnamese | 4.0 /100 | #237 | Tragic 22.0% |
| French Canadians | 2.8 /100 | #238 | Tragic 22.2% |