Immigrants from Venezuela vs Welsh Single Female Poverty
COMPARE
Immigrants from Venezuela
Welsh
Single Female Poverty
Single Female Poverty Comparison
Immigrants from Venezuela
Welsh
20.2%
SINGLE FEMALE POVERTY
91.5/ 100
METRIC RATING
134th/ 347
METRIC RANK
22.0%
SINGLE FEMALE POVERTY
5.0/ 100
METRIC RATING
231st/ 347
METRIC RANK
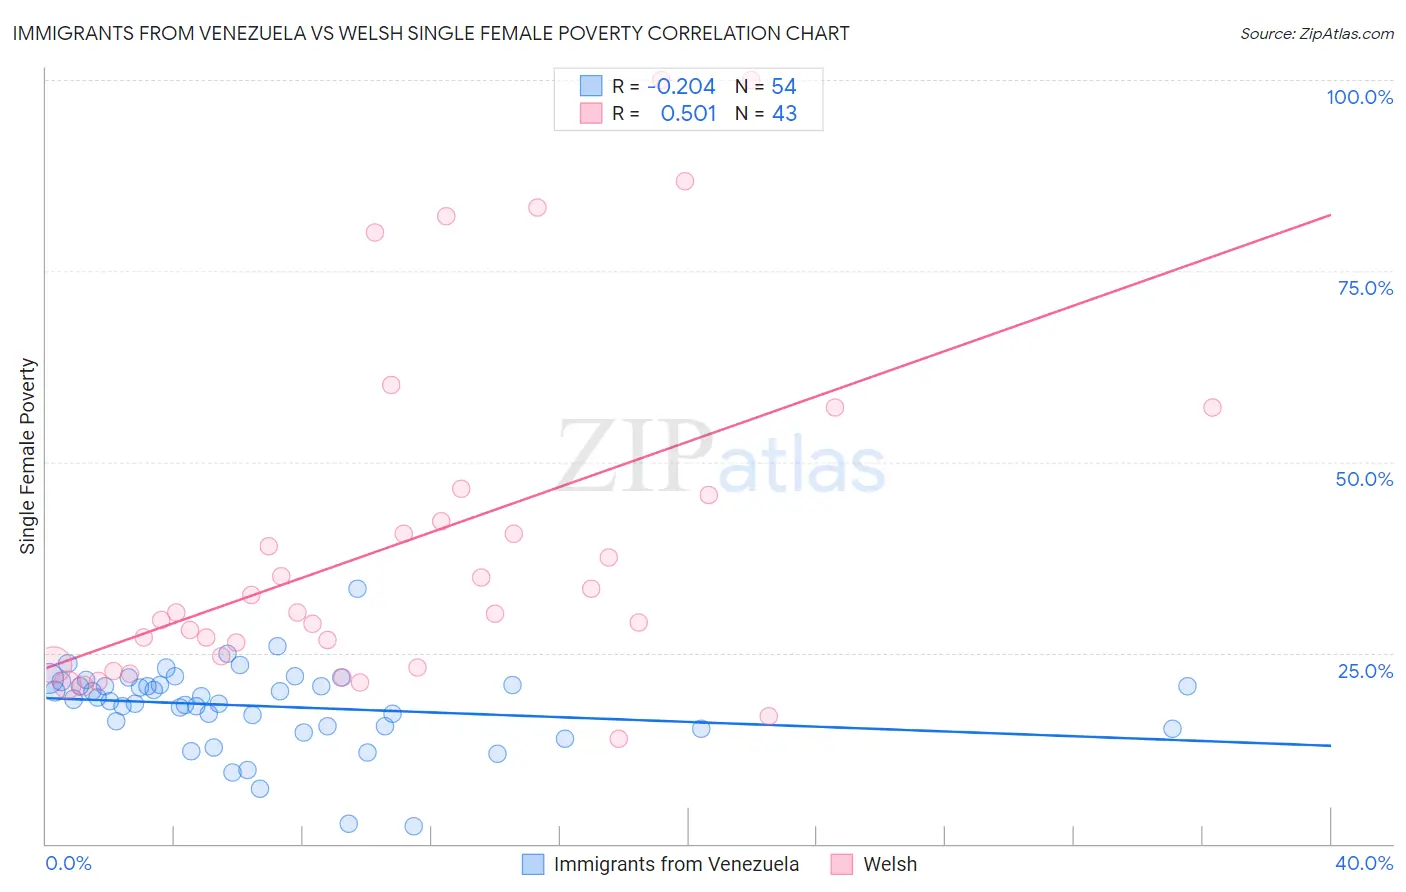
Immigrants from Venezuela vs Welsh Single Female Poverty Correlation Chart
The statistical analysis conducted on geographies consisting of 285,137,962 people shows a weak negative correlation between the proportion of Immigrants from Venezuela and poverty level among single females in the United States with a correlation coefficient (R) of -0.204 and weighted average of 20.2%. Similarly, the statistical analysis conducted on geographies consisting of 513,029,164 people shows a substantial positive correlation between the proportion of Welsh and poverty level among single females in the United States with a correlation coefficient (R) of 0.501 and weighted average of 22.0%, a difference of 8.6%.
Single Female Poverty Correlation Summary
| Measurement | Immigrants from Venezuela | Welsh |
| Minimum | 2.3% | 13.7% |
| Maximum | 33.4% | 100.0% |
| Range | 31.0% | 86.3% |
| Mean | 18.0% | 39.5% |
| Median | 19.0% | 30.2% |
| Interquartile 25% (IQ1) | 15.3% | 23.5% |
| Interquartile 75% (IQ3) | 20.8% | 45.7% |
| Interquartile Range (IQR) | 5.5% | 22.3% |
| Standard Deviation (Sample) | 5.4% | 22.8% |
| Standard Deviation (Population) | 5.4% | 22.5% |
Similar Demographics by Single Female Poverty
Demographics Similar to Immigrants from Venezuela by Single Female Poverty
In terms of single female poverty, the demographic groups most similar to Immigrants from Venezuela are Immigrants from Iraq (20.2%, a difference of 0.050%), Immigrants from Canada (20.2%, a difference of 0.060%), Immigrants from England (20.2%, a difference of 0.090%), Pakistani (20.2%, a difference of 0.12%), and Uruguayan (20.2%, a difference of 0.12%).
| Demographics | Rating | Rank | Single Female Poverty |
| Mongolians | 93.2 /100 | #127 | Exceptional 20.2% |
| Immigrants | Spain | 92.7 /100 | #128 | Exceptional 20.2% |
| Immigrants | Morocco | 92.4 /100 | #129 | Exceptional 20.2% |
| Immigrants | Hungary | 92.3 /100 | #130 | Exceptional 20.2% |
| Pakistanis | 92.1 /100 | #131 | Exceptional 20.2% |
| Uruguayans | 92.1 /100 | #132 | Exceptional 20.2% |
| Immigrants | England | 91.9 /100 | #133 | Exceptional 20.2% |
| Immigrants | Venezuela | 91.5 /100 | #134 | Exceptional 20.2% |
| Immigrants | Iraq | 91.2 /100 | #135 | Exceptional 20.2% |
| Immigrants | Canada | 91.2 /100 | #136 | Exceptional 20.2% |
| Immigrants | Nepal | 90.6 /100 | #137 | Exceptional 20.3% |
| Slovenes | 90.5 /100 | #138 | Exceptional 20.3% |
| Immigrants | Kuwait | 90.4 /100 | #139 | Exceptional 20.3% |
| Syrians | 90.4 /100 | #140 | Exceptional 20.3% |
| Immigrants | North America | 89.5 /100 | #141 | Excellent 20.3% |
Demographics Similar to Welsh by Single Female Poverty
In terms of single female poverty, the demographic groups most similar to Welsh are Immigrants from Thailand (22.0%, a difference of 0.010%), Immigrants from Western Africa (22.0%, a difference of 0.090%), Tlingit-Haida (21.9%, a difference of 0.11%), Spaniard (22.0%, a difference of 0.11%), and Spanish (22.0%, a difference of 0.11%).
| Demographics | Rating | Rank | Single Female Poverty |
| Barbadians | 7.2 /100 | #224 | Tragic 21.8% |
| English | 6.4 /100 | #225 | Tragic 21.9% |
| Immigrants | Portugal | 5.8 /100 | #226 | Tragic 21.9% |
| Immigrants | Ghana | 5.8 /100 | #227 | Tragic 21.9% |
| Salvadorans | 5.5 /100 | #228 | Tragic 21.9% |
| Tlingit-Haida | 5.4 /100 | #229 | Tragic 21.9% |
| Immigrants | Western Africa | 5.3 /100 | #230 | Tragic 22.0% |
| Welsh | 5.0 /100 | #231 | Tragic 22.0% |
| Immigrants | Thailand | 5.0 /100 | #232 | Tragic 22.0% |
| Spaniards | 4.7 /100 | #233 | Tragic 22.0% |
| Spanish | 4.7 /100 | #234 | Tragic 22.0% |
| Dutch | 4.6 /100 | #235 | Tragic 22.0% |
| Immigrants | Ecuador | 4.2 /100 | #236 | Tragic 22.0% |
| Vietnamese | 4.0 /100 | #237 | Tragic 22.0% |
| French Canadians | 2.8 /100 | #238 | Tragic 22.2% |