Belgian vs Welsh Householder Income Under 25 years
COMPARE
Belgian
Welsh
Householder Income Under 25 years
Householder Income Under 25 years Comparison
Belgians
Welsh
$50,113
HOUSEHOLDER INCOME UNDER 25 YEARS
0.6/ 100
METRIC RATING
265th/ 347
METRIC RANK
$50,597
HOUSEHOLDER INCOME UNDER 25 YEARS
2.0/ 100
METRIC RATING
246th/ 347
METRIC RANK
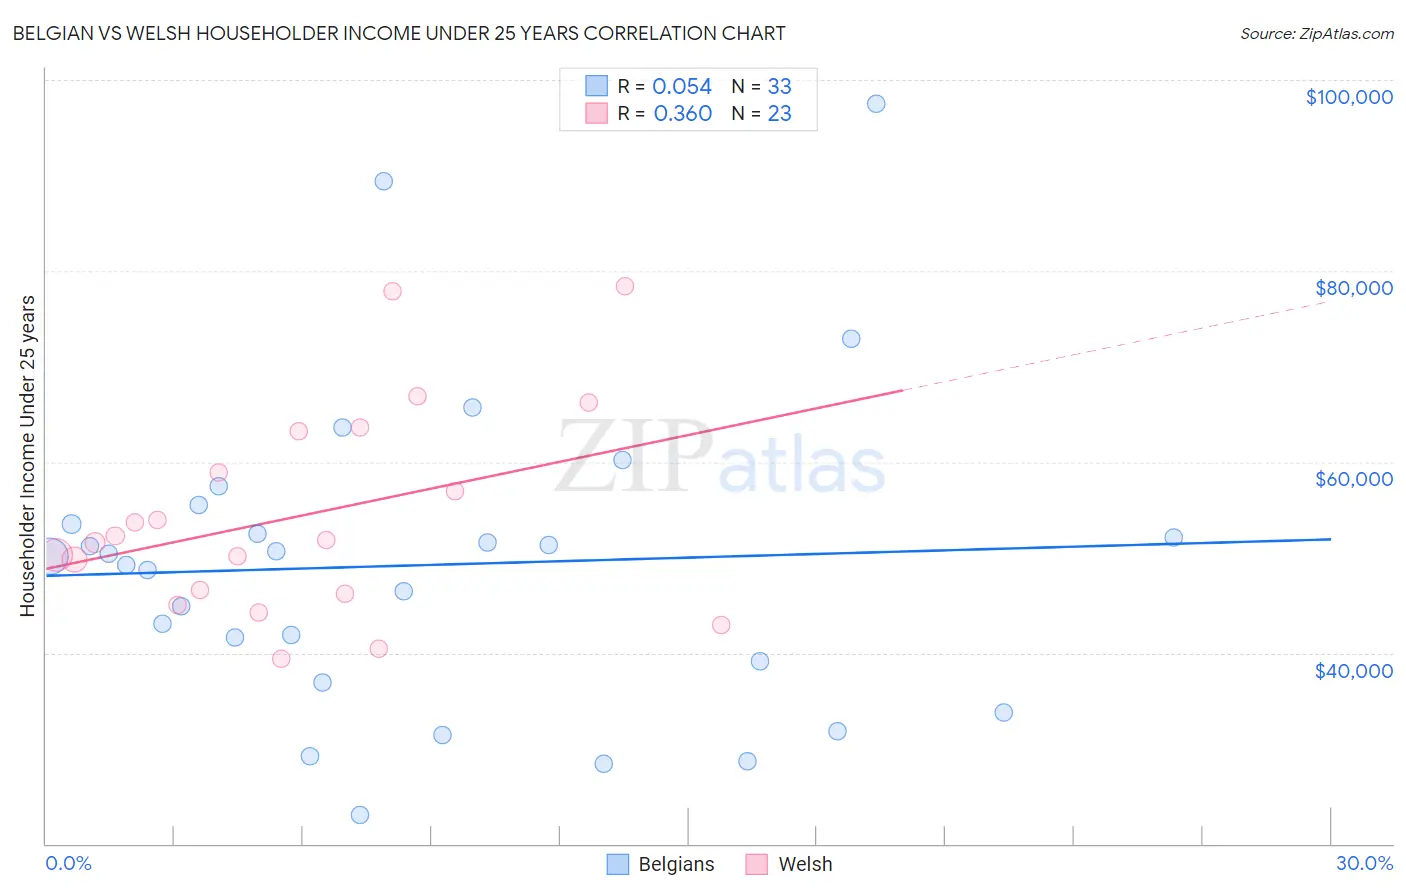
Belgian vs Welsh Householder Income Under 25 years Correlation Chart
The statistical analysis conducted on geographies consisting of 302,930,390 people shows a slight positive correlation between the proportion of Belgians and household income with householder under the age of 25 in the United States with a correlation coefficient (R) of 0.054 and weighted average of $50,113. Similarly, the statistical analysis conducted on geographies consisting of 418,128,856 people shows a mild positive correlation between the proportion of Welsh and household income with householder under the age of 25 in the United States with a correlation coefficient (R) of 0.360 and weighted average of $50,597, a difference of 0.97%.
Householder Income Under 25 years Correlation Summary
| Measurement | Belgian | Welsh |
| Minimum | $22,948 | $39,341 |
| Maximum | $97,500 | $78,342 |
| Range | $74,552 | $39,001 |
| Mean | $49,189 | $54,354 |
| Median | $50,156 | $51,818 |
| Interquartile 25% (IQ1) | $38,023 | $46,242 |
| Interquartile 75% (IQ3) | $54,461 | $63,259 |
| Interquartile Range (IQR) | $16,438 | $17,017 |
| Standard Deviation (Sample) | $16,294 | $10,784 |
| Standard Deviation (Population) | $16,045 | $10,547 |
Demographics Similar to Belgians and Welsh by Householder Income Under 25 years
In terms of householder income under 25 years, the demographic groups most similar to Belgians are Fijian ($50,132, a difference of 0.040%), Immigrants from Dominican Republic ($50,204, a difference of 0.18%), Haitian ($50,231, a difference of 0.24%), Hungarian ($50,247, a difference of 0.27%), and Hispanic or Latino ($50,279, a difference of 0.33%). Similarly, the demographic groups most similar to Welsh are Immigrants from Africa ($50,609, a difference of 0.020%), Immigrants from Bosnia and Herzegovina ($50,565, a difference of 0.060%), Slavic ($50,563, a difference of 0.070%), Scottish ($50,554, a difference of 0.090%), and Immigrants from Cabo Verde ($50,520, a difference of 0.15%).
| Demographics | Rating | Rank | Householder Income Under 25 years |
| Immigrants | Africa | 2.0 /100 | #245 | Tragic $50,609 |
| Welsh | 2.0 /100 | #246 | Tragic $50,597 |
| Immigrants | Bosnia and Herzegovina | 1.8 /100 | #247 | Tragic $50,565 |
| Slavs | 1.8 /100 | #248 | Tragic $50,563 |
| Scottish | 1.8 /100 | #249 | Tragic $50,554 |
| Immigrants | Cabo Verde | 1.7 /100 | #250 | Tragic $50,520 |
| Celtics | 1.4 /100 | #251 | Tragic $50,447 |
| Immigrants | Mexico | 1.3 /100 | #252 | Tragic $50,422 |
| Immigrants | Haiti | 1.2 /100 | #253 | Tragic $50,398 |
| Luxembourgers | 1.2 /100 | #254 | Tragic $50,379 |
| Aleuts | 1.2 /100 | #255 | Tragic $50,377 |
| Immigrants | Cuba | 1.2 /100 | #256 | Tragic $50,374 |
| Lebanese | 1.1 /100 | #257 | Tragic $50,355 |
| Whites/Caucasians | 1.1 /100 | #258 | Tragic $50,336 |
| Immigrants | Dominica | 1.0 /100 | #259 | Tragic $50,301 |
| Hispanics or Latinos | 0.9 /100 | #260 | Tragic $50,279 |
| Hungarians | 0.9 /100 | #261 | Tragic $50,247 |
| Haitians | 0.8 /100 | #262 | Tragic $50,231 |
| Immigrants | Dominican Republic | 0.8 /100 | #263 | Tragic $50,204 |
| Fijians | 0.6 /100 | #264 | Tragic $50,132 |
| Belgians | 0.6 /100 | #265 | Tragic $50,113 |