Belgian vs Welsh No Schooling Completed
COMPARE
Belgian
Welsh
No Schooling Completed
No Schooling Completed Comparison
Belgians
Welsh
1.6%
NO SCHOOLING COMPLETED
99.9/ 100
METRIC RATING
37th/ 347
METRIC RANK
1.5%
NO SCHOOLING COMPLETED
100.0/ 100
METRIC RATING
20th/ 347
METRIC RANK
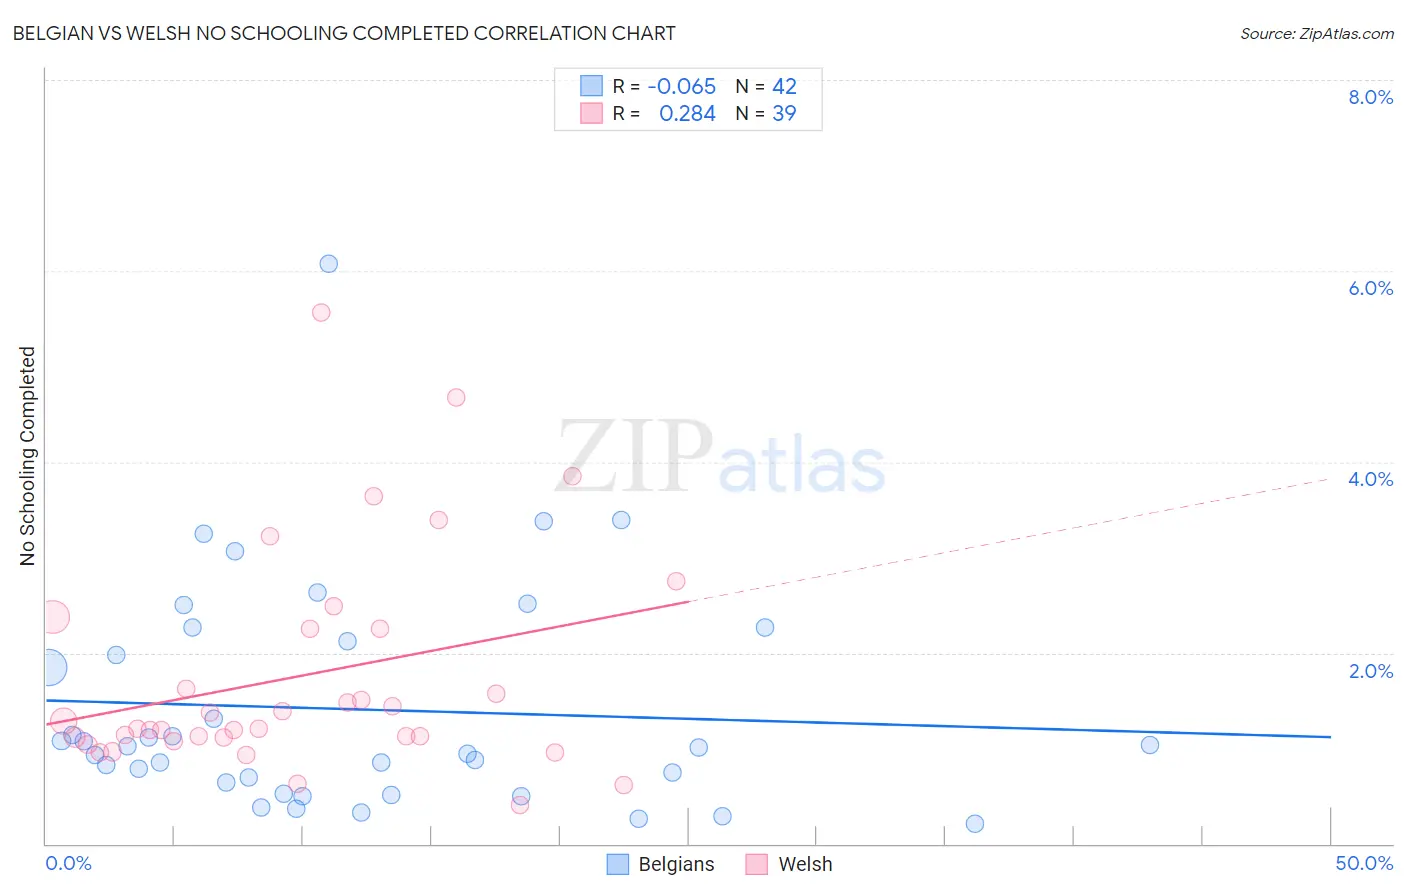
Belgian vs Welsh No Schooling Completed Correlation Chart
The statistical analysis conducted on geographies consisting of 350,991,353 people shows a slight negative correlation between the proportion of Belgians and percentage of population with no schooling in the United States with a correlation coefficient (R) of -0.065 and weighted average of 1.6%. Similarly, the statistical analysis conducted on geographies consisting of 514,712,087 people shows a weak positive correlation between the proportion of Welsh and percentage of population with no schooling in the United States with a correlation coefficient (R) of 0.284 and weighted average of 1.5%, a difference of 7.4%.
No Schooling Completed Correlation Summary
| Measurement | Belgian | Welsh |
| Minimum | 0.22% | 0.40% |
| Maximum | 6.1% | 5.6% |
| Range | 5.9% | 5.2% |
| Mean | 1.4% | 1.8% |
| Median | 1.0% | 1.2% |
| Interquartile 25% (IQ1) | 0.64% | 1.1% |
| Interquartile 75% (IQ3) | 2.1% | 2.2% |
| Interquartile Range (IQR) | 1.5% | 1.1% |
| Standard Deviation (Sample) | 1.2% | 1.2% |
| Standard Deviation (Population) | 1.2% | 1.1% |
Demographics Similar to Belgians and Welsh by No Schooling Completed
In terms of no schooling completed, the demographic groups most similar to Belgians are Northern European (1.6%, a difference of 0.13%), Aleut (1.6%, a difference of 0.27%), Eastern European (1.6%, a difference of 1.3%), Latvian (1.5%, a difference of 2.2%), and Italian (1.5%, a difference of 2.5%). Similarly, the demographic groups most similar to Welsh are Alaskan Athabascan (1.5%, a difference of 0.13%), Danish (1.5%, a difference of 0.23%), Chinese (1.5%, a difference of 0.37%), Alaska Native (1.5%, a difference of 0.46%), and European (1.5%, a difference of 0.71%).
| Demographics | Rating | Rank | No Schooling Completed |
| Danes | 100.0 /100 | #18 | Exceptional 1.5% |
| Alaskan Athabascans | 100.0 /100 | #19 | Exceptional 1.5% |
| Welsh | 100.0 /100 | #20 | Exceptional 1.5% |
| Chinese | 100.0 /100 | #21 | Exceptional 1.5% |
| Alaska Natives | 100.0 /100 | #22 | Exceptional 1.5% |
| Europeans | 100.0 /100 | #23 | Exceptional 1.5% |
| Pennsylvania Germans | 100.0 /100 | #24 | Exceptional 1.5% |
| French | 100.0 /100 | #25 | Exceptional 1.5% |
| Czechs | 100.0 /100 | #26 | Exceptional 1.5% |
| Scandinavians | 100.0 /100 | #27 | Exceptional 1.5% |
| French Canadians | 100.0 /100 | #28 | Exceptional 1.5% |
| Lumbee | 100.0 /100 | #29 | Exceptional 1.5% |
| British | 100.0 /100 | #30 | Exceptional 1.5% |
| Inupiat | 100.0 /100 | #31 | Exceptional 1.5% |
| Swiss | 100.0 /100 | #32 | Exceptional 1.5% |
| Italians | 100.0 /100 | #33 | Exceptional 1.5% |
| Latvians | 100.0 /100 | #34 | Exceptional 1.5% |
| Eastern Europeans | 100.0 /100 | #35 | Exceptional 1.6% |
| Aleuts | 99.9 /100 | #36 | Exceptional 1.6% |
| Belgians | 99.9 /100 | #37 | Exceptional 1.6% |
| Northern Europeans | 99.9 /100 | #38 | Exceptional 1.6% |