Belgian vs Lebanese Median Family Income
COMPARE
Belgian
Lebanese
Median Family Income
Median Family Income Comparison
Belgians
Lebanese
$102,788
MEDIAN FAMILY INCOME
51.4/ 100
METRIC RATING
173rd/ 347
METRIC RANK
$107,086
MEDIAN FAMILY INCOME
90.5/ 100
METRIC RATING
127th/ 347
METRIC RANK
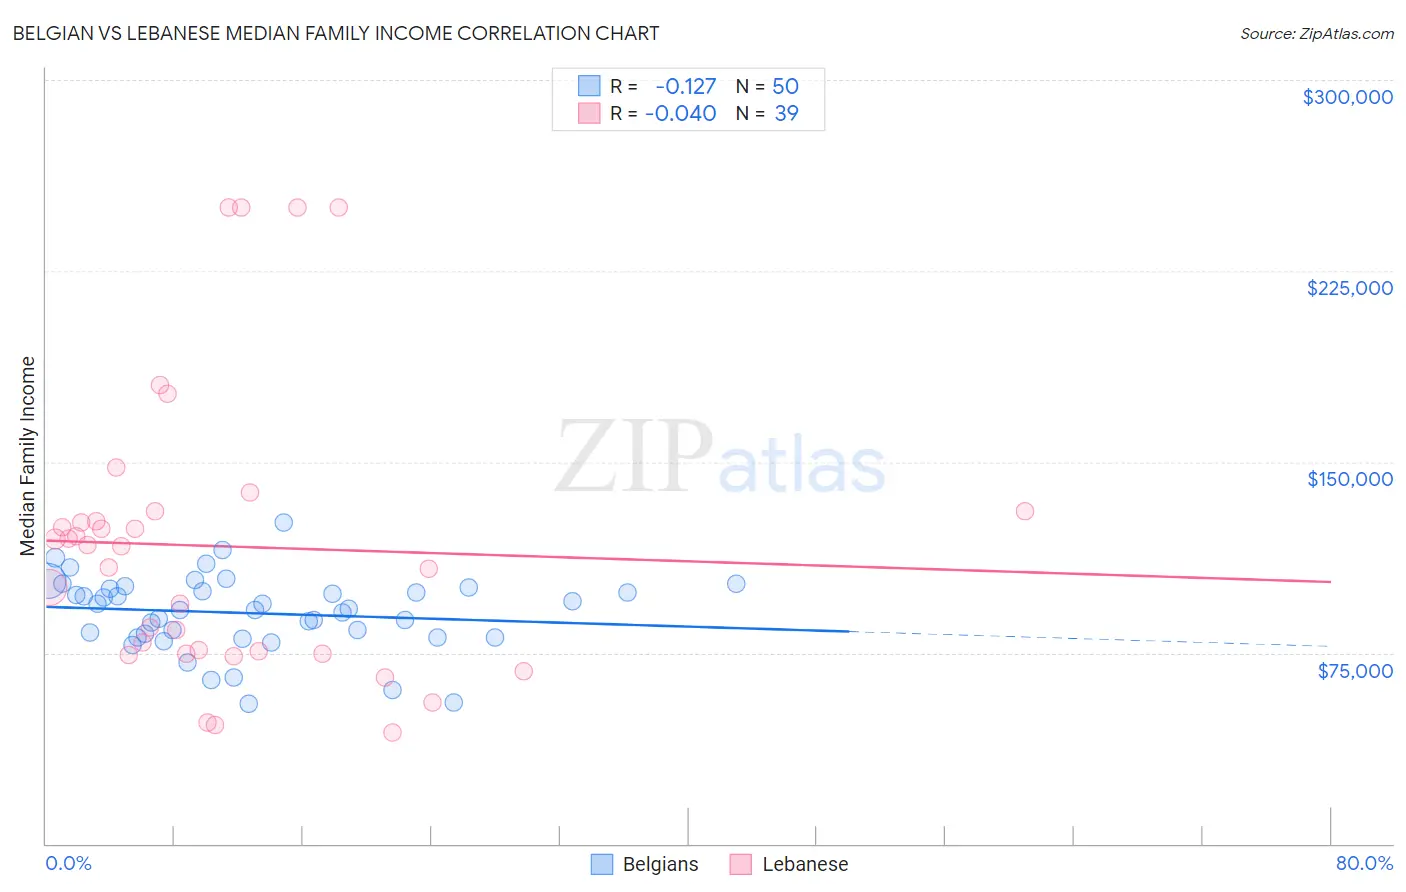
Belgian vs Lebanese Median Family Income Correlation Chart
The statistical analysis conducted on geographies consisting of 355,758,296 people shows a poor negative correlation between the proportion of Belgians and median family income in the United States with a correlation coefficient (R) of -0.127 and weighted average of $102,788. Similarly, the statistical analysis conducted on geographies consisting of 401,188,092 people shows no correlation between the proportion of Lebanese and median family income in the United States with a correlation coefficient (R) of -0.040 and weighted average of $107,086, a difference of 4.2%.
Median Family Income Correlation Summary
| Measurement | Belgian | Lebanese |
| Minimum | $55,000 | $43,594 |
| Maximum | $126,094 | $250,001 |
| Range | $71,094 | $206,407 |
| Mean | $90,563 | $116,877 |
| Median | $92,069 | $116,743 |
| Interquartile 25% (IQ1) | $81,250 | $74,798 |
| Interquartile 75% (IQ3) | $100,134 | $130,372 |
| Interquartile Range (IQR) | $18,884 | $55,574 |
| Standard Deviation (Sample) | $14,839 | $56,099 |
| Standard Deviation (Population) | $14,690 | $55,375 |
Similar Demographics by Median Family Income
Demographics Similar to Belgians by Median Family Income
In terms of median family income, the demographic groups most similar to Belgians are Immigrants from Eritrea ($102,823, a difference of 0.030%), Finnish ($102,676, a difference of 0.11%), Alsatian ($103,010, a difference of 0.22%), Immigrants from Eastern Africa ($102,451, a difference of 0.33%), and Immigrants from Uzbekistan ($103,197, a difference of 0.40%).
| Demographics | Rating | Rank | Median Family Income |
| English | 62.6 /100 | #166 | Good $103,684 |
| South American Indians | 61.9 /100 | #167 | Good $103,624 |
| Immigrants | Peru | 60.8 /100 | #168 | Good $103,534 |
| Czechoslovakians | 57.6 /100 | #169 | Average $103,273 |
| Immigrants | Uzbekistan | 56.6 /100 | #170 | Average $103,197 |
| Alsatians | 54.3 /100 | #171 | Average $103,010 |
| Immigrants | Eritrea | 51.9 /100 | #172 | Average $102,823 |
| Belgians | 51.4 /100 | #173 | Average $102,788 |
| Finns | 50.0 /100 | #174 | Average $102,676 |
| Immigrants | Eastern Africa | 47.1 /100 | #175 | Average $102,451 |
| French | 46.1 /100 | #176 | Average $102,368 |
| Germans | 44.6 /100 | #177 | Average $102,254 |
| Welsh | 43.3 /100 | #178 | Average $102,151 |
| South Americans | 39.7 /100 | #179 | Fair $101,856 |
| French Canadians | 37.0 /100 | #180 | Fair $101,634 |
Demographics Similar to Lebanese by Median Family Income
In terms of median family income, the demographic groups most similar to Lebanese are Serbian ($107,157, a difference of 0.070%), Immigrants from Ethiopia ($106,969, a difference of 0.11%), Arab ($106,952, a difference of 0.12%), Brazilian ($106,942, a difference of 0.13%), and Taiwanese ($107,295, a difference of 0.19%).
| Demographics | Rating | Rank | Median Family Income |
| Immigrants | Northern Africa | 94.3 /100 | #120 | Exceptional $108,161 |
| Europeans | 94.1 /100 | #121 | Exceptional $108,099 |
| Immigrants | Jordan | 92.9 /100 | #122 | Exceptional $107,715 |
| Carpatho Rusyns | 92.2 /100 | #123 | Exceptional $107,502 |
| Pakistanis | 91.7 /100 | #124 | Exceptional $107,390 |
| Taiwanese | 91.4 /100 | #125 | Exceptional $107,295 |
| Serbians | 90.8 /100 | #126 | Exceptional $107,157 |
| Lebanese | 90.5 /100 | #127 | Exceptional $107,086 |
| Immigrants | Ethiopia | 90.0 /100 | #128 | Excellent $106,969 |
| Arabs | 89.9 /100 | #129 | Excellent $106,952 |
| Brazilians | 89.8 /100 | #130 | Excellent $106,942 |
| Canadians | 88.1 /100 | #131 | Excellent $106,597 |
| Immigrants | Fiji | 87.8 /100 | #132 | Excellent $106,544 |
| Ugandans | 87.8 /100 | #133 | Excellent $106,541 |
| Immigrants | Oceania | 87.3 /100 | #134 | Excellent $106,453 |