Belgian vs Lebanese Unemployment Among Ages 25 to 29 years
COMPARE
Belgian
Lebanese
Unemployment Among Ages 25 to 29 years
Unemployment Among Ages 25 to 29 years Comparison
Belgians
Lebanese
6.3%
UNEMPLOYMENT AMONG AGES 25 TO 29 YEARS
97.0/ 100
METRIC RATING
73rd/ 347
METRIC RANK
6.4%
UNEMPLOYMENT AMONG AGES 25 TO 29 YEARS
93.9/ 100
METRIC RATING
90th/ 347
METRIC RANK
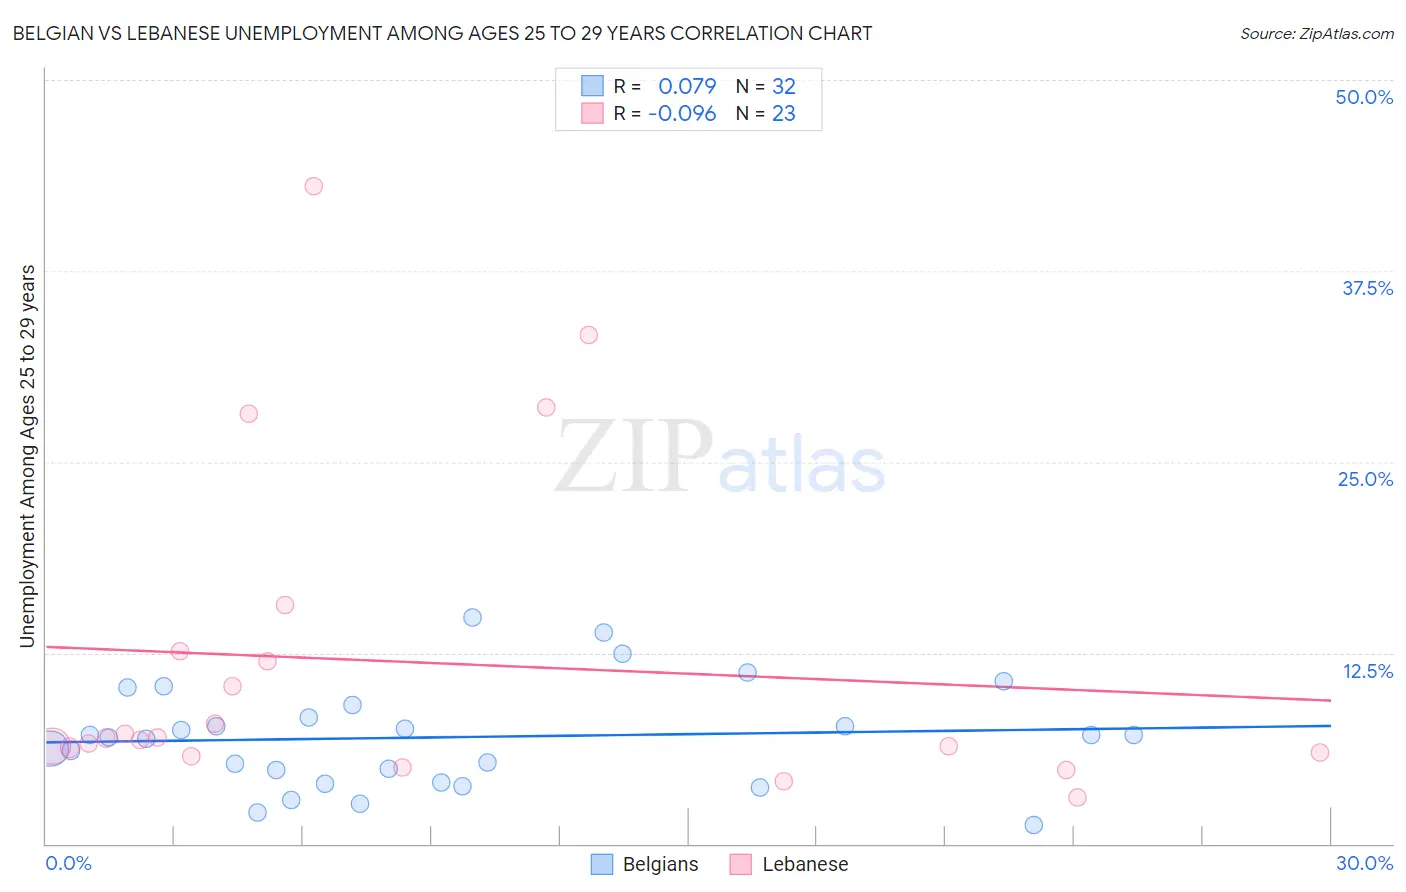
Belgian vs Lebanese Unemployment Among Ages 25 to 29 years Correlation Chart
The statistical analysis conducted on geographies consisting of 334,915,695 people shows a slight positive correlation between the proportion of Belgians and unemployment rate among population between the ages 25 and 29 in the United States with a correlation coefficient (R) of 0.079 and weighted average of 6.3%. Similarly, the statistical analysis conducted on geographies consisting of 380,818,833 people shows a slight negative correlation between the proportion of Lebanese and unemployment rate among population between the ages 25 and 29 in the United States with a correlation coefficient (R) of -0.096 and weighted average of 6.4%, a difference of 1.2%.
Unemployment Among Ages 25 to 29 years Correlation Summary
| Measurement | Belgian | Lebanese |
| Minimum | 1.2% | 3.0% |
| Maximum | 14.8% | 43.0% |
| Range | 13.6% | 40.0% |
| Mean | 7.0% | 11.9% |
| Median | 7.0% | 6.9% |
| Interquartile 25% (IQ1) | 4.4% | 6.0% |
| Interquartile 75% (IQ3) | 8.7% | 12.6% |
| Interquartile Range (IQR) | 4.3% | 6.6% |
| Standard Deviation (Sample) | 3.3% | 10.7% |
| Standard Deviation (Population) | 3.3% | 10.5% |
Demographics Similar to Belgians and Lebanese by Unemployment Among Ages 25 to 29 years
In terms of unemployment among ages 25 to 29 years, the demographic groups most similar to Belgians are Carpatho Rusyn (6.3%, a difference of 0.020%), Immigrants from Jordan (6.3%, a difference of 0.090%), Immigrants from Korea (6.3%, a difference of 0.16%), Icelander (6.3%, a difference of 0.18%), and Scandinavian (6.3%, a difference of 0.25%). Similarly, the demographic groups most similar to Lebanese are Egyptian (6.4%, a difference of 0.010%), Immigrants from Oceania (6.4%, a difference of 0.070%), Immigrants from Indonesia (6.4%, a difference of 0.18%), Marshallese (6.4%, a difference of 0.24%), and Immigrants from Asia (6.3%, a difference of 0.29%).
| Demographics | Rating | Rank | Unemployment Among Ages 25 to 29 years |
| Immigrants | France | 97.4 /100 | #71 | Exceptional 6.3% |
| Scandinavians | 97.4 /100 | #72 | Exceptional 6.3% |
| Belgians | 97.0 /100 | #73 | Exceptional 6.3% |
| Carpatho Rusyns | 96.9 /100 | #74 | Exceptional 6.3% |
| Immigrants | Jordan | 96.8 /100 | #75 | Exceptional 6.3% |
| Immigrants | Korea | 96.7 /100 | #76 | Exceptional 6.3% |
| Icelanders | 96.6 /100 | #77 | Exceptional 6.3% |
| Asians | 96.4 /100 | #78 | Exceptional 6.3% |
| Immigrants | Switzerland | 96.0 /100 | #79 | Exceptional 6.3% |
| Immigrants | Romania | 95.9 /100 | #80 | Exceptional 6.3% |
| Iranians | 95.8 /100 | #81 | Exceptional 6.3% |
| Immigrants | Poland | 95.7 /100 | #82 | Exceptional 6.3% |
| Slovenes | 95.3 /100 | #83 | Exceptional 6.3% |
| Immigrants | Spain | 95.2 /100 | #84 | Exceptional 6.3% |
| Immigrants | Sweden | 95.1 /100 | #85 | Exceptional 6.3% |
| Immigrants | Asia | 94.9 /100 | #86 | Exceptional 6.3% |
| Marshallese | 94.7 /100 | #87 | Exceptional 6.4% |
| Immigrants | Indonesia | 94.5 /100 | #88 | Exceptional 6.4% |
| Immigrants | Oceania | 94.1 /100 | #89 | Exceptional 6.4% |
| Lebanese | 93.9 /100 | #90 | Exceptional 6.4% |
| Egyptians | 93.9 /100 | #91 | Exceptional 6.4% |