Belgian vs Immigrants from Sudan In Labor Force | Age 25-29
COMPARE
Belgian
Immigrants from Sudan
In Labor Force | Age 25-29
In Labor Force | Age 25-29 Comparison
Belgians
Immigrants from Sudan
85.5%
IN LABOR FORCE | AGE 25-29
99.7/ 100
METRIC RATING
53rd/ 347
METRIC RANK
85.1%
IN LABOR FORCE | AGE 25-29
94.3/ 100
METRIC RATING
97th/ 347
METRIC RANK
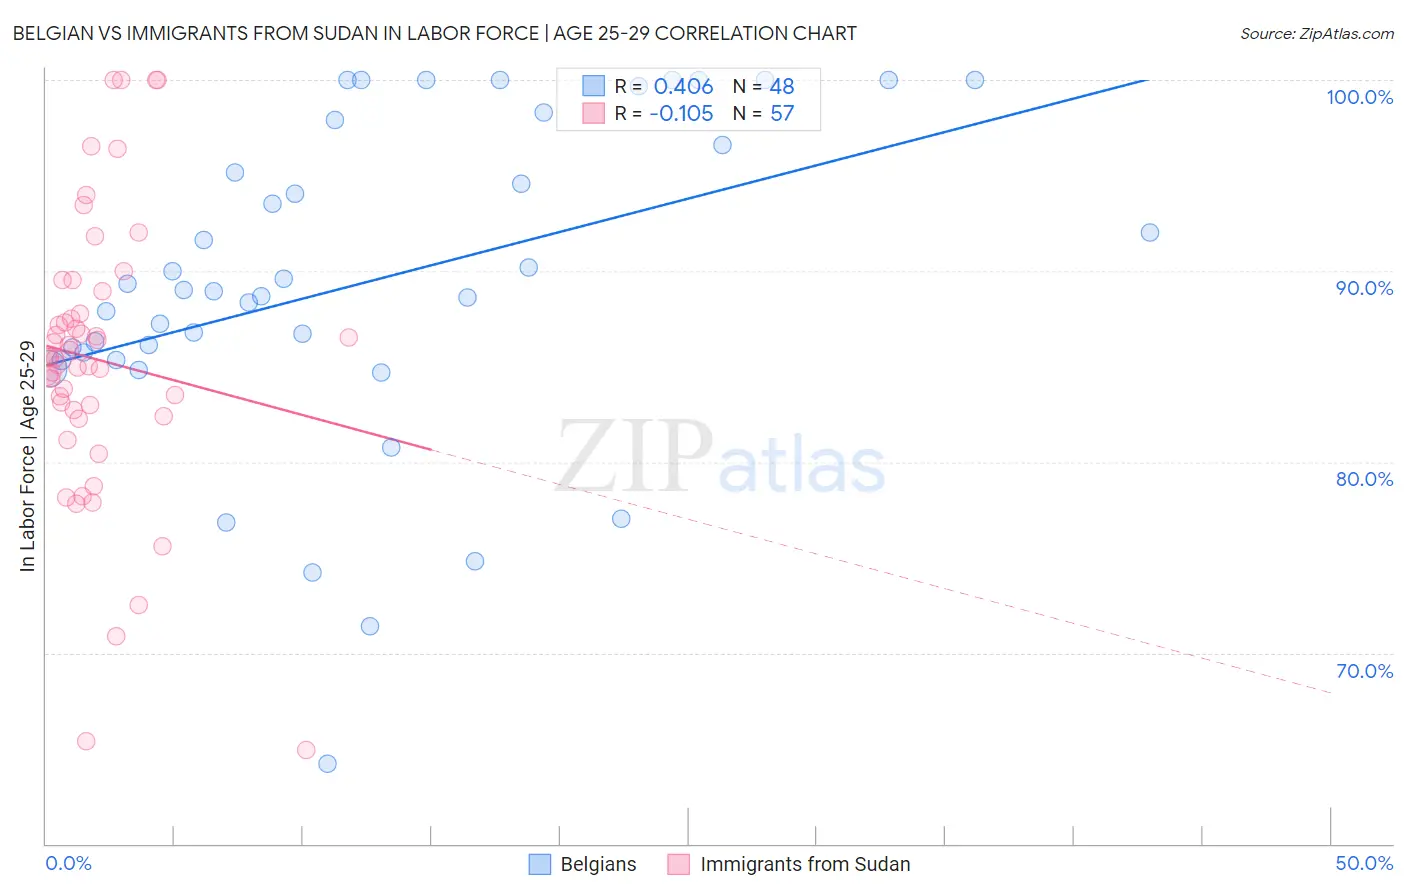
Belgian vs Immigrants from Sudan In Labor Force | Age 25-29 Correlation Chart
The statistical analysis conducted on geographies consisting of 355,849,084 people shows a moderate positive correlation between the proportion of Belgians and labor force participation rate among population between the ages 25 and 29 in the United States with a correlation coefficient (R) of 0.406 and weighted average of 85.5%. Similarly, the statistical analysis conducted on geographies consisting of 118,966,602 people shows a poor negative correlation between the proportion of Immigrants from Sudan and labor force participation rate among population between the ages 25 and 29 in the United States with a correlation coefficient (R) of -0.105 and weighted average of 85.1%, a difference of 0.54%.
In Labor Force | Age 25-29 Correlation Summary
| Measurement | Belgian | Immigrants from Sudan |
| Minimum | 64.2% | 64.9% |
| Maximum | 100.0% | 100.0% |
| Range | 35.8% | 35.1% |
| Mean | 89.4% | 85.4% |
| Median | 89.0% | 85.5% |
| Interquartile 25% (IQ1) | 85.5% | 82.6% |
| Interquartile 75% (IQ3) | 97.3% | 88.3% |
| Interquartile Range (IQR) | 11.7% | 5.8% |
| Standard Deviation (Sample) | 8.5% | 7.4% |
| Standard Deviation (Population) | 8.4% | 7.3% |
Similar Demographics by In Labor Force | Age 25-29
Demographics Similar to Belgians by In Labor Force | Age 25-29
In terms of in labor force | age 25-29, the demographic groups most similar to Belgians are Albanian (85.5%, a difference of 0.0%), Immigrants from Brazil (85.5%, a difference of 0.010%), Immigrants from Poland (85.6%, a difference of 0.030%), Eastern European (85.5%, a difference of 0.040%), and Yugoslavian (85.6%, a difference of 0.050%).
| Demographics | Rating | Rank | In Labor Force | Age 25-29 |
| Czechs | 99.8 /100 | #46 | Exceptional 85.6% |
| Turks | 99.8 /100 | #47 | Exceptional 85.6% |
| Italians | 99.8 /100 | #48 | Exceptional 85.6% |
| Swedes | 99.8 /100 | #49 | Exceptional 85.6% |
| Yugoslavians | 99.8 /100 | #50 | Exceptional 85.6% |
| Immigrants | Latvia | 99.8 /100 | #51 | Exceptional 85.6% |
| Immigrants | Poland | 99.7 /100 | #52 | Exceptional 85.6% |
| Belgians | 99.7 /100 | #53 | Exceptional 85.5% |
| Albanians | 99.7 /100 | #54 | Exceptional 85.5% |
| Immigrants | Brazil | 99.7 /100 | #55 | Exceptional 85.5% |
| Eastern Europeans | 99.6 /100 | #56 | Exceptional 85.5% |
| Estonians | 99.6 /100 | #57 | Exceptional 85.5% |
| Greeks | 99.6 /100 | #58 | Exceptional 85.5% |
| Immigrants | Morocco | 99.5 /100 | #59 | Exceptional 85.5% |
| Thais | 99.5 /100 | #60 | Exceptional 85.5% |
Demographics Similar to Immigrants from Sudan by In Labor Force | Age 25-29
In terms of in labor force | age 25-29, the demographic groups most similar to Immigrants from Sudan are Immigrants from Netherlands (85.1%, a difference of 0.010%), Immigrants from Romania (85.1%, a difference of 0.010%), Mongolian (85.1%, a difference of 0.010%), Bangladeshi (85.1%, a difference of 0.010%), and Immigrants from Switzerland (85.1%, a difference of 0.010%).
| Demographics | Rating | Rank | In Labor Force | Age 25-29 |
| Burmese | 95.9 /100 | #90 | Exceptional 85.1% |
| Immigrants | Moldova | 95.8 /100 | #91 | Exceptional 85.1% |
| Immigrants | Costa Rica | 95.5 /100 | #92 | Exceptional 85.1% |
| Austrians | 95.3 /100 | #93 | Exceptional 85.1% |
| Immigrants | Korea | 94.8 /100 | #94 | Exceptional 85.1% |
| Immigrants | Netherlands | 94.6 /100 | #95 | Exceptional 85.1% |
| Immigrants | Romania | 94.6 /100 | #96 | Exceptional 85.1% |
| Immigrants | Sudan | 94.3 /100 | #97 | Exceptional 85.1% |
| Mongolians | 94.1 /100 | #98 | Exceptional 85.1% |
| Bangladeshis | 94.0 /100 | #99 | Exceptional 85.1% |
| Immigrants | Switzerland | 93.9 /100 | #100 | Exceptional 85.1% |
| Egyptians | 93.8 /100 | #101 | Exceptional 85.1% |
| Slavs | 93.7 /100 | #102 | Exceptional 85.1% |
| Immigrants | Japan | 93.5 /100 | #103 | Exceptional 85.1% |
| Immigrants | Zaire | 93.3 /100 | #104 | Exceptional 85.1% |