Belgian vs Immigrants from Sudan 5th Grade
COMPARE
Belgian
Immigrants from Sudan
5th Grade
5th Grade Comparison
Belgians
Immigrants from Sudan
98.1%
5TH GRADE
99.9/ 100
METRIC RATING
38th/ 347
METRIC RANK
97.1%
5TH GRADE
6.5/ 100
METRIC RATING
218th/ 347
METRIC RANK
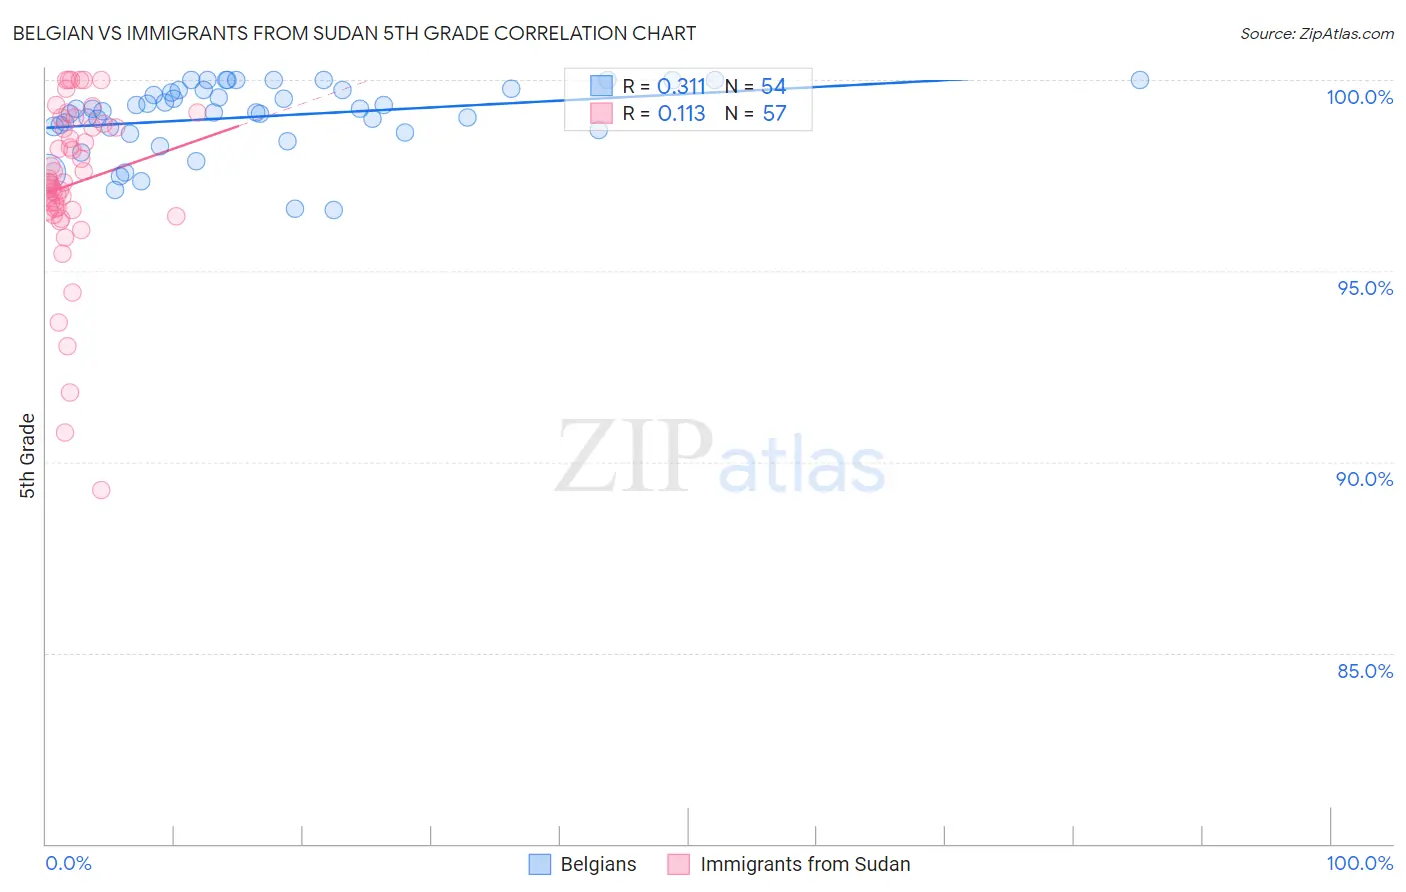
Belgian vs Immigrants from Sudan 5th Grade Correlation Chart
The statistical analysis conducted on geographies consisting of 356,016,627 people shows a mild positive correlation between the proportion of Belgians and percentage of population with at least 5th grade education in the United States with a correlation coefficient (R) of 0.311 and weighted average of 98.1%. Similarly, the statistical analysis conducted on geographies consisting of 118,959,807 people shows a poor positive correlation between the proportion of Immigrants from Sudan and percentage of population with at least 5th grade education in the United States with a correlation coefficient (R) of 0.113 and weighted average of 97.1%, a difference of 1.1%.
5th Grade Correlation Summary
| Measurement | Belgian | Immigrants from Sudan |
| Minimum | 96.6% | 89.3% |
| Maximum | 100.0% | 100.0% |
| Range | 3.4% | 10.7% |
| Mean | 99.0% | 97.3% |
| Median | 99.2% | 97.3% |
| Interquartile 25% (IQ1) | 98.7% | 96.6% |
| Interquartile 75% (IQ3) | 99.7% | 98.8% |
| Interquartile Range (IQR) | 1.0% | 2.2% |
| Standard Deviation (Sample) | 0.90% | 2.2% |
| Standard Deviation (Population) | 0.89% | 2.2% |
Similar Demographics by 5th Grade
Demographics Similar to Belgians by 5th Grade
In terms of 5th grade, the demographic groups most similar to Belgians are Latvian (98.1%, a difference of 0.010%), Luxembourger (98.1%, a difference of 0.010%), Eastern European (98.1%, a difference of 0.010%), British (98.1%, a difference of 0.030%), and Italian (98.1%, a difference of 0.040%).
| Demographics | Rating | Rank | 5th Grade |
| Europeans | 100.0 /100 | #31 | Exceptional 98.2% |
| Chippewa | 100.0 /100 | #32 | Exceptional 98.1% |
| Swiss | 100.0 /100 | #33 | Exceptional 98.1% |
| Chinese | 100.0 /100 | #34 | Exceptional 98.1% |
| Italians | 100.0 /100 | #35 | Exceptional 98.1% |
| British | 100.0 /100 | #36 | Exceptional 98.1% |
| Latvians | 99.9 /100 | #37 | Exceptional 98.1% |
| Belgians | 99.9 /100 | #38 | Exceptional 98.1% |
| Luxembourgers | 99.9 /100 | #39 | Exceptional 98.1% |
| Eastern Europeans | 99.9 /100 | #40 | Exceptional 98.1% |
| Hungarians | 99.9 /100 | #41 | Exceptional 98.0% |
| Northern Europeans | 99.9 /100 | #42 | Exceptional 98.0% |
| Ottawa | 99.9 /100 | #43 | Exceptional 98.0% |
| Aleuts | 99.9 /100 | #44 | Exceptional 98.0% |
| Czechoslovakians | 99.9 /100 | #45 | Exceptional 98.0% |
Demographics Similar to Immigrants from Sudan by 5th Grade
In terms of 5th grade, the demographic groups most similar to Immigrants from Sudan are Immigrants from Lebanon (97.1%, a difference of 0.0%), Immigrants from Syria (97.1%, a difference of 0.0%), Immigrants from Southern Europe (97.1%, a difference of 0.0%), Immigrants from Morocco (97.1%, a difference of 0.010%), and Sudanese (97.1%, a difference of 0.010%).
| Demographics | Rating | Rank | 5th Grade |
| Samoans | 8.5 /100 | #211 | Tragic 97.1% |
| Immigrants | Iraq | 8.3 /100 | #212 | Tragic 97.1% |
| Portuguese | 7.8 /100 | #213 | Tragic 97.1% |
| Costa Ricans | 7.7 /100 | #214 | Tragic 97.1% |
| Immigrants | Morocco | 7.5 /100 | #215 | Tragic 97.1% |
| Sudanese | 7.0 /100 | #216 | Tragic 97.1% |
| Immigrants | Lebanon | 6.8 /100 | #217 | Tragic 97.1% |
| Immigrants | Sudan | 6.5 /100 | #218 | Tragic 97.1% |
| Immigrants | Syria | 6.4 /100 | #219 | Tragic 97.1% |
| Immigrants | Southern Europe | 6.3 /100 | #220 | Tragic 97.1% |
| Sierra Leoneans | 6.0 /100 | #221 | Tragic 97.1% |
| Immigrants | Panama | 5.7 /100 | #222 | Tragic 97.0% |
| Liberians | 5.7 /100 | #223 | Tragic 97.0% |
| South American Indians | 5.4 /100 | #224 | Tragic 97.0% |
| Bahamians | 5.3 /100 | #225 | Tragic 97.0% |