Barbadian vs Immigrants from Senegal Single Father Poverty
COMPARE
Barbadian
Immigrants from Senegal
Single Father Poverty
Single Father Poverty Comparison
Barbadians
Immigrants from Senegal
17.5%
SINGLE FATHER POVERTY
0.1/ 100
METRIC RATING
272nd/ 347
METRIC RANK
16.6%
SINGLE FATHER POVERTY
13.7/ 100
METRIC RATING
206th/ 347
METRIC RANK
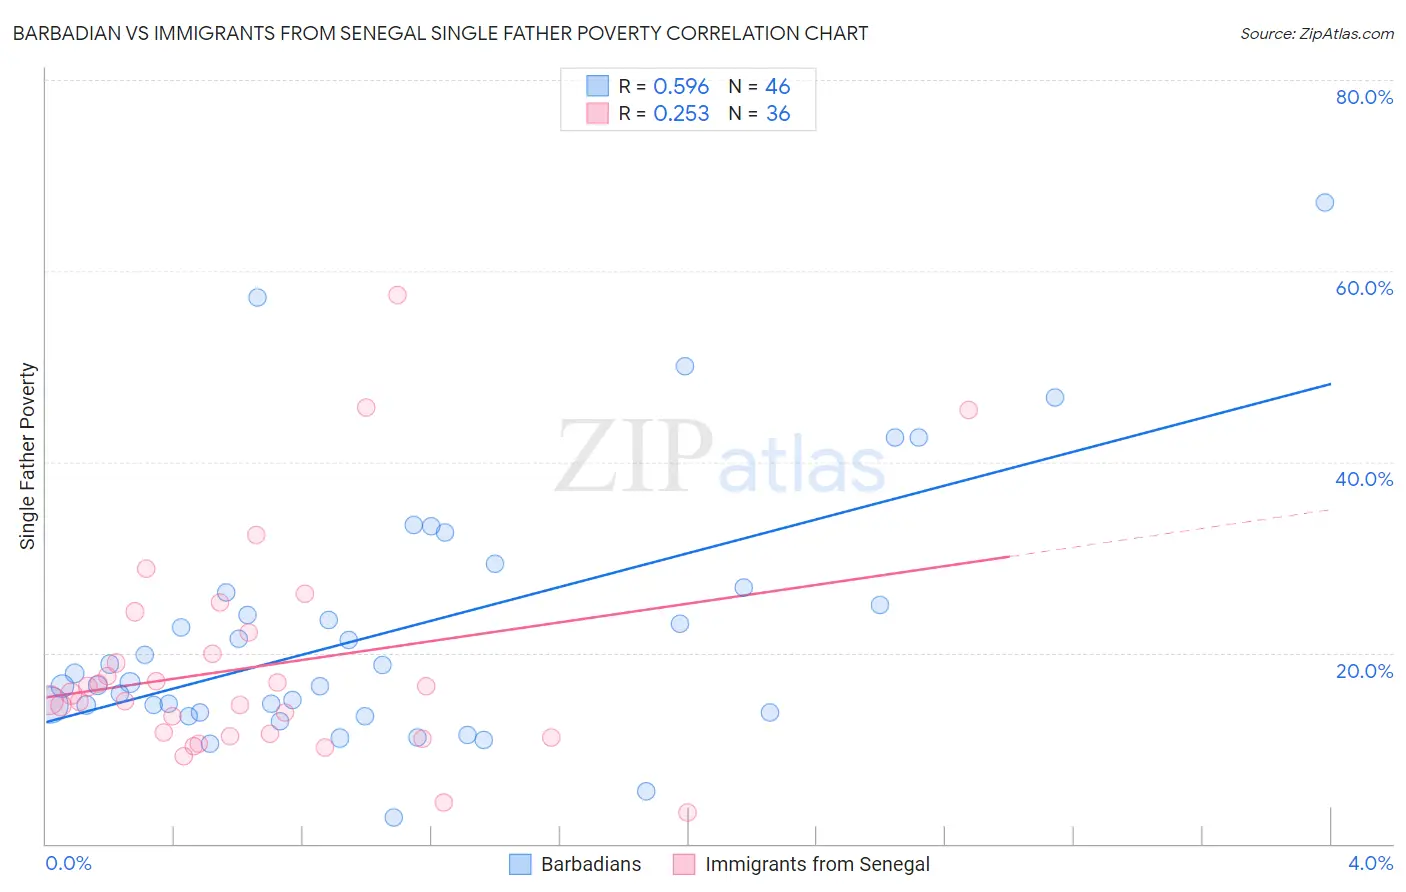
Barbadian vs Immigrants from Senegal Single Father Poverty Correlation Chart
The statistical analysis conducted on geographies consisting of 128,228,135 people shows a substantial positive correlation between the proportion of Barbadians and poverty level among single fathers in the United States with a correlation coefficient (R) of 0.596 and weighted average of 17.5%. Similarly, the statistical analysis conducted on geographies consisting of 83,824,522 people shows a weak positive correlation between the proportion of Immigrants from Senegal and poverty level among single fathers in the United States with a correlation coefficient (R) of 0.253 and weighted average of 16.6%, a difference of 5.2%.
Single Father Poverty Correlation Summary
| Measurement | Barbadian | Immigrants from Senegal |
| Minimum | 2.8% | 3.3% |
| Maximum | 67.2% | 57.4% |
| Range | 64.4% | 54.2% |
| Mean | 22.3% | 18.6% |
| Median | 17.4% | 15.4% |
| Interquartile 25% (IQ1) | 13.7% | 11.4% |
| Interquartile 75% (IQ3) | 26.3% | 21.1% |
| Interquartile Range (IQR) | 12.6% | 9.7% |
| Standard Deviation (Sample) | 13.4% | 11.4% |
| Standard Deviation (Population) | 13.3% | 11.3% |
Similar Demographics by Single Father Poverty
Demographics Similar to Barbadians by Single Father Poverty
In terms of single father poverty, the demographic groups most similar to Barbadians are Italian (17.5%, a difference of 0.28%), French American Indian (17.4%, a difference of 0.35%), Indonesian (17.4%, a difference of 0.48%), Slavic (17.4%, a difference of 0.74%), and Immigrants from Caribbean (17.4%, a difference of 0.81%).
| Demographics | Rating | Rank | Single Father Poverty |
| Poles | 0.3 /100 | #265 | Tragic 17.3% |
| Jamaicans | 0.3 /100 | #266 | Tragic 17.3% |
| Haitians | 0.3 /100 | #267 | Tragic 17.3% |
| Immigrants | Caribbean | 0.3 /100 | #268 | Tragic 17.4% |
| Slavs | 0.3 /100 | #269 | Tragic 17.4% |
| Indonesians | 0.2 /100 | #270 | Tragic 17.4% |
| French American Indians | 0.2 /100 | #271 | Tragic 17.4% |
| Barbadians | 0.1 /100 | #272 | Tragic 17.5% |
| Italians | 0.1 /100 | #273 | Tragic 17.5% |
| Macedonians | 0.1 /100 | #274 | Tragic 17.7% |
| British West Indians | 0.0 /100 | #275 | Tragic 17.7% |
| German Russians | 0.0 /100 | #276 | Tragic 17.7% |
| Lebanese | 0.0 /100 | #277 | Tragic 17.7% |
| Germans | 0.0 /100 | #278 | Tragic 17.7% |
| Iroquois | 0.0 /100 | #279 | Tragic 17.7% |
Demographics Similar to Immigrants from Senegal by Single Father Poverty
In terms of single father poverty, the demographic groups most similar to Immigrants from Senegal are New Zealander (16.6%, a difference of 0.0%), Eastern European (16.6%, a difference of 0.0%), Venezuelan (16.6%, a difference of 0.050%), European (16.6%, a difference of 0.050%), and Guatemalan (16.6%, a difference of 0.080%).
| Demographics | Rating | Rank | Single Father Poverty |
| Immigrants | Belize | 19.8 /100 | #199 | Poor 16.5% |
| Syrians | 17.4 /100 | #200 | Poor 16.6% |
| Cubans | 16.5 /100 | #201 | Poor 16.6% |
| Immigrants | Croatia | 16.5 /100 | #202 | Poor 16.6% |
| Immigrants | North America | 15.1 /100 | #203 | Poor 16.6% |
| Immigrants | Guatemala | 14.8 /100 | #204 | Poor 16.6% |
| Venezuelans | 14.3 /100 | #205 | Poor 16.6% |
| Immigrants | Senegal | 13.7 /100 | #206 | Poor 16.6% |
| New Zealanders | 13.7 /100 | #207 | Poor 16.6% |
| Eastern Europeans | 13.7 /100 | #208 | Poor 16.6% |
| Europeans | 13.2 /100 | #209 | Poor 16.6% |
| Guatemalans | 12.9 /100 | #210 | Poor 16.6% |
| Arabs | 12.8 /100 | #211 | Poor 16.6% |
| Immigrants | Southern Europe | 11.2 /100 | #212 | Poor 16.7% |
| Ghanaians | 11.0 /100 | #213 | Poor 16.7% |