African vs Immigrants from Senegal Single Father Poverty
COMPARE
African
Immigrants from Senegal
Single Father Poverty
Single Father Poverty Comparison
Africans
Immigrants from Senegal
18.3%
SINGLE FATHER POVERTY
0.0/ 100
METRIC RATING
298th/ 347
METRIC RANK
16.6%
SINGLE FATHER POVERTY
13.7/ 100
METRIC RATING
206th/ 347
METRIC RANK
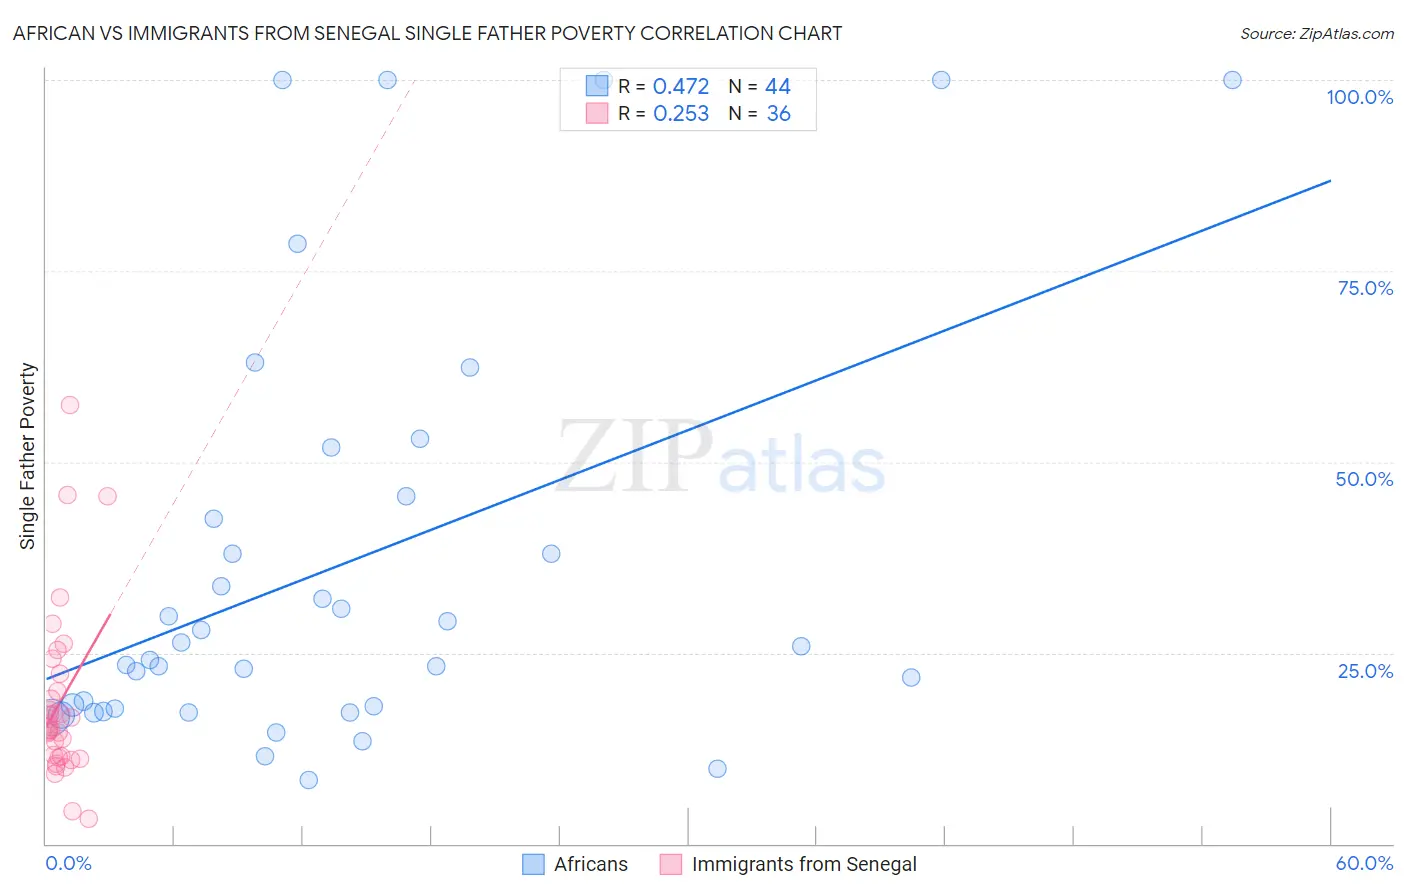
African vs Immigrants from Senegal Single Father Poverty Correlation Chart
The statistical analysis conducted on geographies consisting of 369,651,911 people shows a moderate positive correlation between the proportion of Africans and poverty level among single fathers in the United States with a correlation coefficient (R) of 0.472 and weighted average of 18.3%. Similarly, the statistical analysis conducted on geographies consisting of 83,824,522 people shows a weak positive correlation between the proportion of Immigrants from Senegal and poverty level among single fathers in the United States with a correlation coefficient (R) of 0.253 and weighted average of 16.6%, a difference of 10.2%.
Single Father Poverty Correlation Summary
| Measurement | African | Immigrants from Senegal |
| Minimum | 8.3% | 3.3% |
| Maximum | 100.0% | 57.4% |
| Range | 91.7% | 54.2% |
| Mean | 36.4% | 18.6% |
| Median | 25.0% | 15.4% |
| Interquartile 25% (IQ1) | 17.5% | 11.4% |
| Interquartile 75% (IQ3) | 44.0% | 21.1% |
| Interquartile Range (IQR) | 26.5% | 9.7% |
| Standard Deviation (Sample) | 27.5% | 11.4% |
| Standard Deviation (Population) | 27.1% | 11.3% |
Similar Demographics by Single Father Poverty
Demographics Similar to Africans by Single Father Poverty
In terms of single father poverty, the demographic groups most similar to Africans are White/Caucasian (18.4%, a difference of 0.21%), Immigrants from Dominican Republic (18.4%, a difference of 0.53%), French (18.2%, a difference of 0.75%), Hungarian (18.5%, a difference of 0.75%), and Comanche (18.5%, a difference of 0.86%).
| Demographics | Rating | Rank | Single Father Poverty |
| Alaskan Athabascans | 0.0 /100 | #291 | Tragic 18.1% |
| Immigrants | Bahamas | 0.0 /100 | #292 | Tragic 18.1% |
| Alaska Natives | 0.0 /100 | #293 | Tragic 18.1% |
| U.S. Virgin Islanders | 0.0 /100 | #294 | Tragic 18.1% |
| Yakama | 0.0 /100 | #295 | Tragic 18.1% |
| Seminole | 0.0 /100 | #296 | Tragic 18.1% |
| French | 0.0 /100 | #297 | Tragic 18.2% |
| Africans | 0.0 /100 | #298 | Tragic 18.3% |
| Whites/Caucasians | 0.0 /100 | #299 | Tragic 18.4% |
| Immigrants | Dominican Republic | 0.0 /100 | #300 | Tragic 18.4% |
| Hungarians | 0.0 /100 | #301 | Tragic 18.5% |
| Comanche | 0.0 /100 | #302 | Tragic 18.5% |
| Celtics | 0.0 /100 | #303 | Tragic 18.5% |
| Ute | 0.0 /100 | #304 | Tragic 18.5% |
| Blackfeet | 0.0 /100 | #305 | Tragic 18.5% |
Demographics Similar to Immigrants from Senegal by Single Father Poverty
In terms of single father poverty, the demographic groups most similar to Immigrants from Senegal are New Zealander (16.6%, a difference of 0.0%), Eastern European (16.6%, a difference of 0.0%), Venezuelan (16.6%, a difference of 0.050%), European (16.6%, a difference of 0.050%), and Guatemalan (16.6%, a difference of 0.080%).
| Demographics | Rating | Rank | Single Father Poverty |
| Immigrants | Belize | 19.8 /100 | #199 | Poor 16.5% |
| Syrians | 17.4 /100 | #200 | Poor 16.6% |
| Cubans | 16.5 /100 | #201 | Poor 16.6% |
| Immigrants | Croatia | 16.5 /100 | #202 | Poor 16.6% |
| Immigrants | North America | 15.1 /100 | #203 | Poor 16.6% |
| Immigrants | Guatemala | 14.8 /100 | #204 | Poor 16.6% |
| Venezuelans | 14.3 /100 | #205 | Poor 16.6% |
| Immigrants | Senegal | 13.7 /100 | #206 | Poor 16.6% |
| New Zealanders | 13.7 /100 | #207 | Poor 16.6% |
| Eastern Europeans | 13.7 /100 | #208 | Poor 16.6% |
| Europeans | 13.2 /100 | #209 | Poor 16.6% |
| Guatemalans | 12.9 /100 | #210 | Poor 16.6% |
| Arabs | 12.8 /100 | #211 | Poor 16.6% |
| Immigrants | Southern Europe | 11.2 /100 | #212 | Poor 16.7% |
| Ghanaians | 11.0 /100 | #213 | Poor 16.7% |