Barbadian vs Subsaharan African Single Father Poverty
COMPARE
Barbadian
Subsaharan African
Single Father Poverty
Single Father Poverty Comparison
Barbadians
Sub-Saharan Africans
17.5%
SINGLE FATHER POVERTY
0.1/ 100
METRIC RATING
272nd/ 347
METRIC RANK
16.9%
SINGLE FATHER POVERTY
2.9/ 100
METRIC RATING
237th/ 347
METRIC RANK
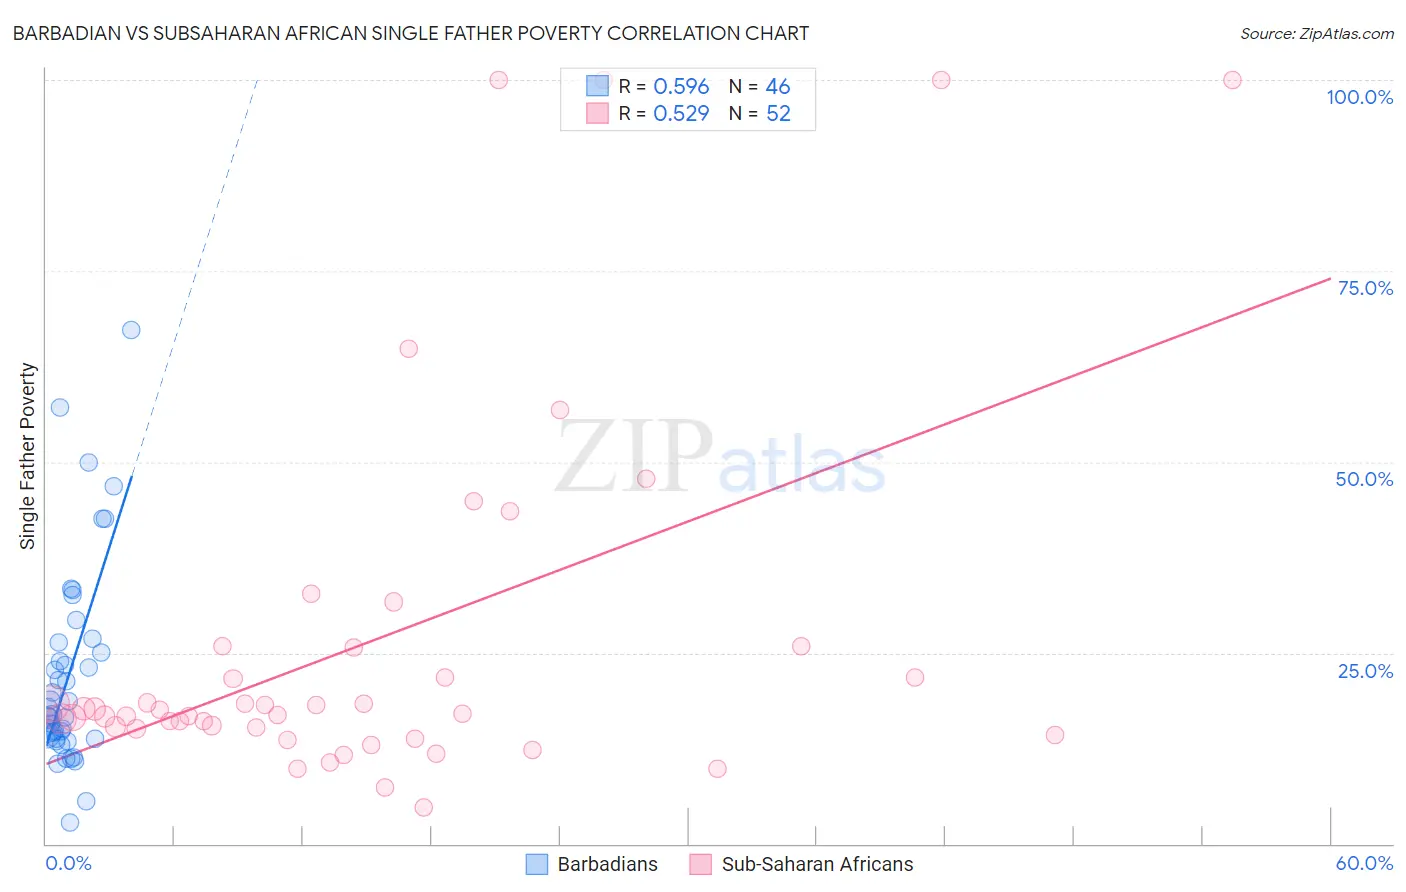
Barbadian vs Subsaharan African Single Father Poverty Correlation Chart
The statistical analysis conducted on geographies consisting of 128,228,135 people shows a substantial positive correlation between the proportion of Barbadians and poverty level among single fathers in the United States with a correlation coefficient (R) of 0.596 and weighted average of 17.5%. Similarly, the statistical analysis conducted on geographies consisting of 386,638,837 people shows a substantial positive correlation between the proportion of Sub-Saharan Africans and poverty level among single fathers in the United States with a correlation coefficient (R) of 0.529 and weighted average of 16.9%, a difference of 3.4%.
Single Father Poverty Correlation Summary
| Measurement | Barbadian | Subsaharan African |
| Minimum | 2.8% | 4.8% |
| Maximum | 67.2% | 100.0% |
| Range | 64.4% | 95.2% |
| Mean | 22.3% | 26.7% |
| Median | 17.4% | 17.3% |
| Interquartile 25% (IQ1) | 13.7% | 15.1% |
| Interquartile 75% (IQ3) | 26.3% | 25.8% |
| Interquartile Range (IQR) | 12.6% | 10.6% |
| Standard Deviation (Sample) | 13.4% | 24.4% |
| Standard Deviation (Population) | 13.3% | 24.1% |
Similar Demographics by Single Father Poverty
Demographics Similar to Barbadians by Single Father Poverty
In terms of single father poverty, the demographic groups most similar to Barbadians are Italian (17.5%, a difference of 0.28%), French American Indian (17.4%, a difference of 0.35%), Indonesian (17.4%, a difference of 0.48%), Slavic (17.4%, a difference of 0.74%), and Immigrants from Caribbean (17.4%, a difference of 0.81%).
| Demographics | Rating | Rank | Single Father Poverty |
| Poles | 0.3 /100 | #265 | Tragic 17.3% |
| Jamaicans | 0.3 /100 | #266 | Tragic 17.3% |
| Haitians | 0.3 /100 | #267 | Tragic 17.3% |
| Immigrants | Caribbean | 0.3 /100 | #268 | Tragic 17.4% |
| Slavs | 0.3 /100 | #269 | Tragic 17.4% |
| Indonesians | 0.2 /100 | #270 | Tragic 17.4% |
| French American Indians | 0.2 /100 | #271 | Tragic 17.4% |
| Barbadians | 0.1 /100 | #272 | Tragic 17.5% |
| Italians | 0.1 /100 | #273 | Tragic 17.5% |
| Macedonians | 0.1 /100 | #274 | Tragic 17.7% |
| British West Indians | 0.0 /100 | #275 | Tragic 17.7% |
| German Russians | 0.0 /100 | #276 | Tragic 17.7% |
| Lebanese | 0.0 /100 | #277 | Tragic 17.7% |
| Germans | 0.0 /100 | #278 | Tragic 17.7% |
| Iroquois | 0.0 /100 | #279 | Tragic 17.7% |
Demographics Similar to Sub-Saharan Africans by Single Father Poverty
In terms of single father poverty, the demographic groups most similar to Sub-Saharan Africans are Immigrants from Western Europe (16.9%, a difference of 0.0%), Immigrants from Germany (16.9%, a difference of 0.0%), Immigrants from Saudi Arabia (16.9%, a difference of 0.070%), Bermudan (16.9%, a difference of 0.090%), and Marshallese (16.9%, a difference of 0.10%).
| Demographics | Rating | Rank | Single Father Poverty |
| Immigrants | Trinidad and Tobago | 4.5 /100 | #230 | Tragic 16.8% |
| Spanish Americans | 3.7 /100 | #231 | Tragic 16.9% |
| Immigrants | Grenada | 3.7 /100 | #232 | Tragic 16.9% |
| Senegalese | 3.2 /100 | #233 | Tragic 16.9% |
| Marshallese | 3.1 /100 | #234 | Tragic 16.9% |
| Immigrants | Western Europe | 2.9 /100 | #235 | Tragic 16.9% |
| Immigrants | Germany | 2.9 /100 | #236 | Tragic 16.9% |
| Sub-Saharan Africans | 2.9 /100 | #237 | Tragic 16.9% |
| Immigrants | Saudi Arabia | 2.7 /100 | #238 | Tragic 16.9% |
| Bermudans | 2.6 /100 | #239 | Tragic 16.9% |
| Finns | 2.6 /100 | #240 | Tragic 16.9% |
| Czechs | 2.3 /100 | #241 | Tragic 17.0% |
| Moroccans | 2.1 /100 | #242 | Tragic 17.0% |
| Immigrants | Cabo Verde | 1.6 /100 | #243 | Tragic 17.0% |
| Hondurans | 1.6 /100 | #244 | Tragic 17.0% |