Barbadian vs Immigrants from El Salvador Single Father Poverty
COMPARE
Barbadian
Immigrants from El Salvador
Single Father Poverty
Single Father Poverty Comparison
Barbadians
Immigrants from El Salvador
17.5%
SINGLE FATHER POVERTY
0.1/ 100
METRIC RATING
272nd/ 347
METRIC RANK
15.0%
SINGLE FATHER POVERTY
99.9/ 100
METRIC RATING
52nd/ 347
METRIC RANK
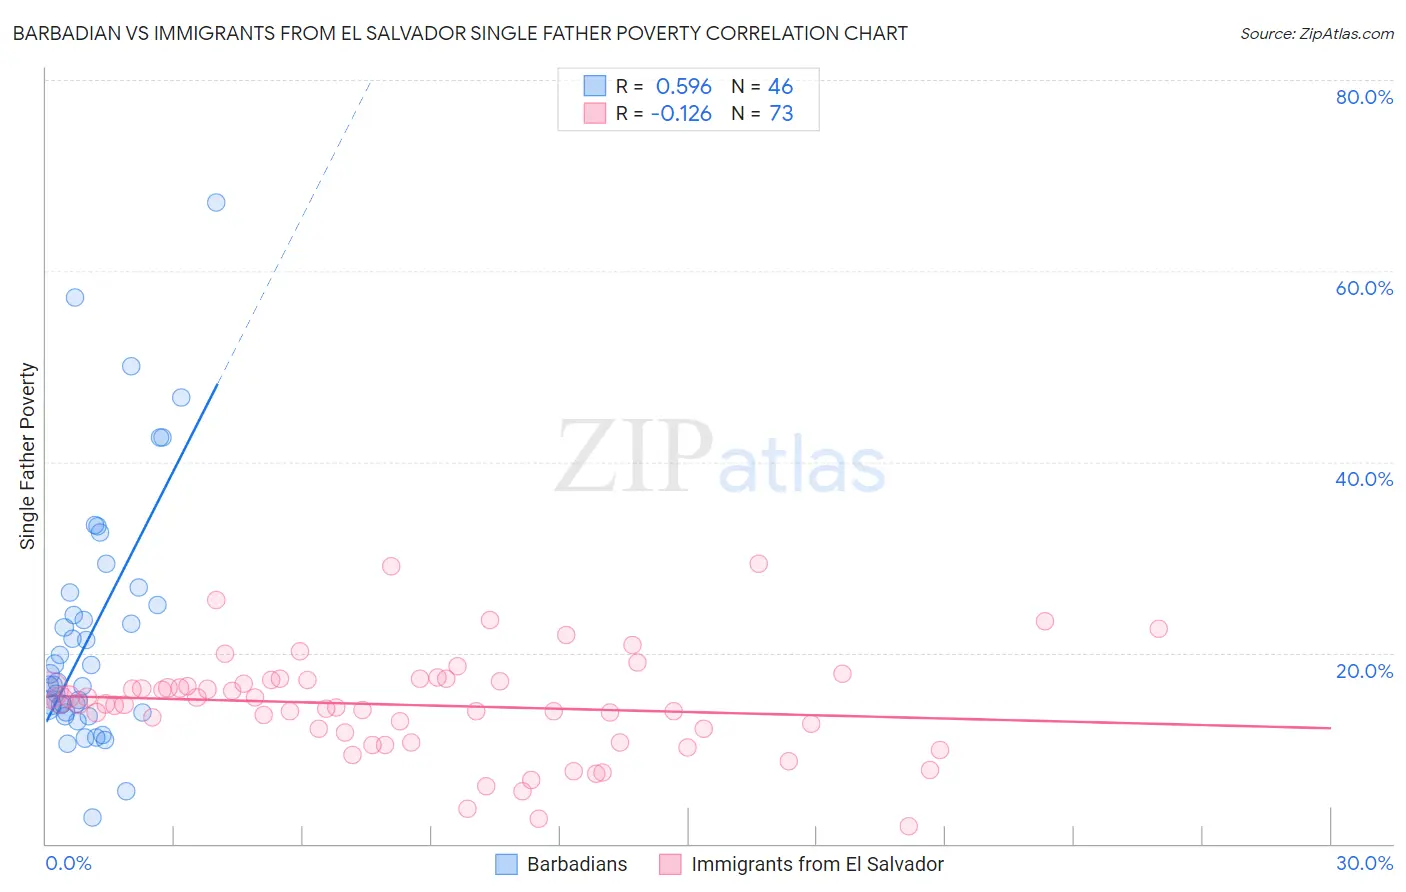
Barbadian vs Immigrants from El Salvador Single Father Poverty Correlation Chart
The statistical analysis conducted on geographies consisting of 128,228,135 people shows a substantial positive correlation between the proportion of Barbadians and poverty level among single fathers in the United States with a correlation coefficient (R) of 0.596 and weighted average of 17.5%. Similarly, the statistical analysis conducted on geographies consisting of 292,495,730 people shows a poor negative correlation between the proportion of Immigrants from El Salvador and poverty level among single fathers in the United States with a correlation coefficient (R) of -0.126 and weighted average of 15.0%, a difference of 16.8%.
Single Father Poverty Correlation Summary
| Measurement | Barbadian | Immigrants from El Salvador |
| Minimum | 2.8% | 1.9% |
| Maximum | 67.2% | 29.3% |
| Range | 64.4% | 27.4% |
| Mean | 22.3% | 14.5% |
| Median | 17.4% | 14.7% |
| Interquartile 25% (IQ1) | 13.7% | 11.1% |
| Interquartile 75% (IQ3) | 26.3% | 17.2% |
| Interquartile Range (IQR) | 12.6% | 6.0% |
| Standard Deviation (Sample) | 13.4% | 5.4% |
| Standard Deviation (Population) | 13.3% | 5.3% |
Similar Demographics by Single Father Poverty
Demographics Similar to Barbadians by Single Father Poverty
In terms of single father poverty, the demographic groups most similar to Barbadians are Italian (17.5%, a difference of 0.28%), French American Indian (17.4%, a difference of 0.35%), Indonesian (17.4%, a difference of 0.48%), Slavic (17.4%, a difference of 0.74%), and Immigrants from Caribbean (17.4%, a difference of 0.81%).
| Demographics | Rating | Rank | Single Father Poverty |
| Poles | 0.3 /100 | #265 | Tragic 17.3% |
| Jamaicans | 0.3 /100 | #266 | Tragic 17.3% |
| Haitians | 0.3 /100 | #267 | Tragic 17.3% |
| Immigrants | Caribbean | 0.3 /100 | #268 | Tragic 17.4% |
| Slavs | 0.3 /100 | #269 | Tragic 17.4% |
| Indonesians | 0.2 /100 | #270 | Tragic 17.4% |
| French American Indians | 0.2 /100 | #271 | Tragic 17.4% |
| Barbadians | 0.1 /100 | #272 | Tragic 17.5% |
| Italians | 0.1 /100 | #273 | Tragic 17.5% |
| Macedonians | 0.1 /100 | #274 | Tragic 17.7% |
| British West Indians | 0.0 /100 | #275 | Tragic 17.7% |
| German Russians | 0.0 /100 | #276 | Tragic 17.7% |
| Lebanese | 0.0 /100 | #277 | Tragic 17.7% |
| Germans | 0.0 /100 | #278 | Tragic 17.7% |
| Iroquois | 0.0 /100 | #279 | Tragic 17.7% |
Demographics Similar to Immigrants from El Salvador by Single Father Poverty
In terms of single father poverty, the demographic groups most similar to Immigrants from El Salvador are Immigrants from Pakistan (15.0%, a difference of 0.040%), Immigrants from Kenya (15.0%, a difference of 0.040%), Bhutanese (15.0%, a difference of 0.060%), Immigrants from Eastern Asia (15.0%, a difference of 0.11%), and Immigrants from Uzbekistan (15.0%, a difference of 0.22%).
| Demographics | Rating | Rank | Single Father Poverty |
| Immigrants | Somalia | 100.0 /100 | #45 | Exceptional 14.9% |
| Immigrants | Cambodia | 99.9 /100 | #46 | Exceptional 14.9% |
| Immigrants | China | 99.9 /100 | #47 | Exceptional 14.9% |
| Malaysians | 99.9 /100 | #48 | Exceptional 14.9% |
| Immigrants | Eastern Asia | 99.9 /100 | #49 | Exceptional 15.0% |
| Bhutanese | 99.9 /100 | #50 | Exceptional 15.0% |
| Immigrants | Pakistan | 99.9 /100 | #51 | Exceptional 15.0% |
| Immigrants | El Salvador | 99.9 /100 | #52 | Exceptional 15.0% |
| Immigrants | Kenya | 99.9 /100 | #53 | Exceptional 15.0% |
| Immigrants | Uzbekistan | 99.9 /100 | #54 | Exceptional 15.0% |
| Immigrants | Bulgaria | 99.9 /100 | #55 | Exceptional 15.0% |
| Immigrants | Laos | 99.9 /100 | #56 | Exceptional 15.1% |
| Laotians | 99.9 /100 | #57 | Exceptional 15.1% |
| Hawaiians | 99.9 /100 | #58 | Exceptional 15.1% |
| Guamanians/Chamorros | 99.9 /100 | #59 | Exceptional 15.1% |