Barbadian vs Immigrants from Senegal In Labor Force | Age 20-64
COMPARE
Barbadian
Immigrants from Senegal
In Labor Force | Age 20-64
In Labor Force | Age 20-64 Comparison
Barbadians
Immigrants from Senegal
78.8%
IN LABOR FORCE | AGE 20-64
0.7/ 100
METRIC RATING
251st/ 347
METRIC RANK
79.4%
IN LABOR FORCE | AGE 20-64
22.5/ 100
METRIC RATING
197th/ 347
METRIC RANK
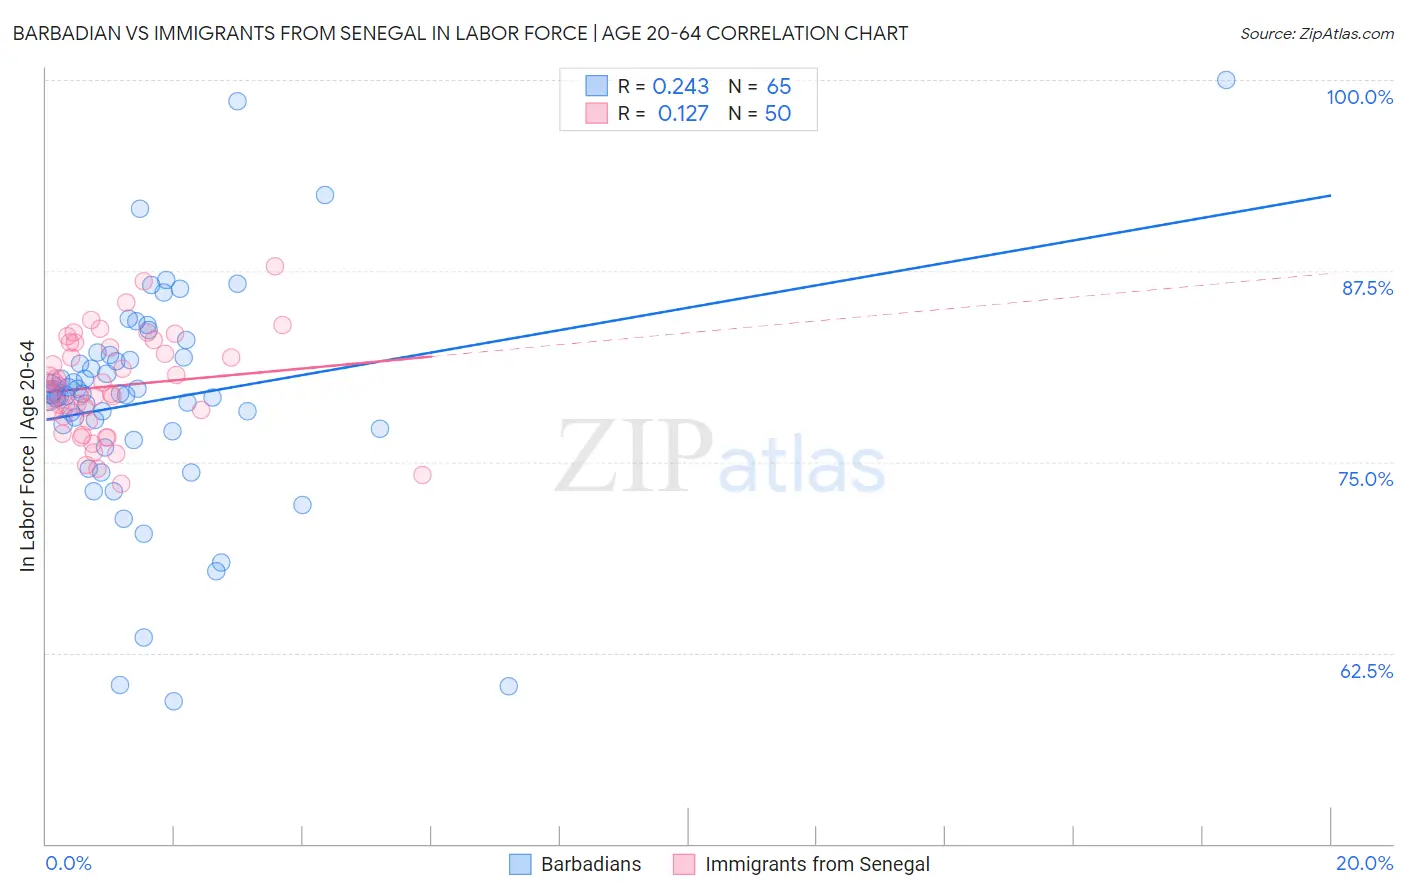
Barbadian vs Immigrants from Senegal In Labor Force | Age 20-64 Correlation Chart
The statistical analysis conducted on geographies consisting of 141,304,311 people shows a weak positive correlation between the proportion of Barbadians and labor force participation rate among population between the ages 20 and 64 in the United States with a correlation coefficient (R) of 0.243 and weighted average of 78.8%. Similarly, the statistical analysis conducted on geographies consisting of 90,128,419 people shows a poor positive correlation between the proportion of Immigrants from Senegal and labor force participation rate among population between the ages 20 and 64 in the United States with a correlation coefficient (R) of 0.127 and weighted average of 79.4%, a difference of 0.74%.
In Labor Force | Age 20-64 Correlation Summary
| Measurement | Barbadian | Immigrants from Senegal |
| Minimum | 59.3% | 73.6% |
| Maximum | 100.0% | 87.8% |
| Range | 40.7% | 14.2% |
| Mean | 79.0% | 80.0% |
| Median | 79.4% | 79.7% |
| Interquartile 25% (IQ1) | 76.7% | 77.6% |
| Interquartile 75% (IQ3) | 81.9% | 82.8% |
| Interquartile Range (IQR) | 5.2% | 5.1% |
| Standard Deviation (Sample) | 7.4% | 3.3% |
| Standard Deviation (Population) | 7.4% | 3.3% |
Similar Demographics by In Labor Force | Age 20-64
Demographics Similar to Barbadians by In Labor Force | Age 20-64
In terms of in labor force | age 20-64, the demographic groups most similar to Barbadians are English (78.8%, a difference of 0.030%), Honduran (78.8%, a difference of 0.030%), Immigrants from Honduras (78.7%, a difference of 0.050%), Immigrants from Germany (78.8%, a difference of 0.060%), and Immigrants from Caribbean (78.8%, a difference of 0.060%).
| Demographics | Rating | Rank | In Labor Force | Age 20-64 |
| French | 1.5 /100 | #244 | Tragic 78.9% |
| Scottish | 1.3 /100 | #245 | Tragic 78.9% |
| Immigrants | Trinidad and Tobago | 1.1 /100 | #246 | Tragic 78.8% |
| Immigrants | Germany | 1.0 /100 | #247 | Tragic 78.8% |
| Immigrants | Caribbean | 1.0 /100 | #248 | Tragic 78.8% |
| English | 0.9 /100 | #249 | Tragic 78.8% |
| Hondurans | 0.8 /100 | #250 | Tragic 78.8% |
| Barbadians | 0.7 /100 | #251 | Tragic 78.8% |
| Immigrants | Honduras | 0.6 /100 | #252 | Tragic 78.7% |
| Basques | 0.5 /100 | #253 | Tragic 78.7% |
| Immigrants | Lebanon | 0.5 /100 | #254 | Tragic 78.7% |
| Hawaiians | 0.5 /100 | #255 | Tragic 78.7% |
| Celtics | 0.5 /100 | #256 | Tragic 78.7% |
| Guatemalans | 0.4 /100 | #257 | Tragic 78.7% |
| Immigrants | Guatemala | 0.4 /100 | #258 | Tragic 78.7% |
Demographics Similar to Immigrants from Senegal by In Labor Force | Age 20-64
In terms of in labor force | age 20-64, the demographic groups most similar to Immigrants from Senegal are Immigrants from Austria (79.4%, a difference of 0.010%), Ecuadorian (79.4%, a difference of 0.010%), Immigrants from Laos (79.4%, a difference of 0.010%), Immigrants from Thailand (79.4%, a difference of 0.020%), and Dutch (79.3%, a difference of 0.030%).
| Demographics | Rating | Rank | In Labor Force | Age 20-64 |
| Immigrants | Syria | 30.8 /100 | #190 | Fair 79.4% |
| Swiss | 28.9 /100 | #191 | Fair 79.4% |
| Immigrants | Denmark | 26.9 /100 | #192 | Fair 79.4% |
| Indonesians | 26.1 /100 | #193 | Fair 79.4% |
| Immigrants | Thailand | 24.8 /100 | #194 | Fair 79.4% |
| Immigrants | Austria | 23.7 /100 | #195 | Fair 79.4% |
| Ecuadorians | 23.1 /100 | #196 | Fair 79.4% |
| Immigrants | Senegal | 22.5 /100 | #197 | Fair 79.4% |
| Immigrants | Laos | 21.5 /100 | #198 | Fair 79.4% |
| Dutch | 20.2 /100 | #199 | Fair 79.3% |
| Immigrants | Oceania | 19.1 /100 | #200 | Poor 79.3% |
| Immigrants | Nicaragua | 19.0 /100 | #201 | Poor 79.3% |
| Nicaraguans | 18.3 /100 | #202 | Poor 79.3% |
| Iraqis | 17.7 /100 | #203 | Poor 79.3% |
| Immigrants | Cambodia | 17.6 /100 | #204 | Poor 79.3% |