Barbadian vs Australian Single Father Poverty
COMPARE
Barbadian
Australian
Single Father Poverty
Single Father Poverty Comparison
Barbadians
Australians
17.5%
SINGLE FATHER POVERTY
0.1/ 100
METRIC RATING
272nd/ 347
METRIC RANK
15.7%
SINGLE FATHER POVERTY
96.1/ 100
METRIC RATING
104th/ 347
METRIC RANK
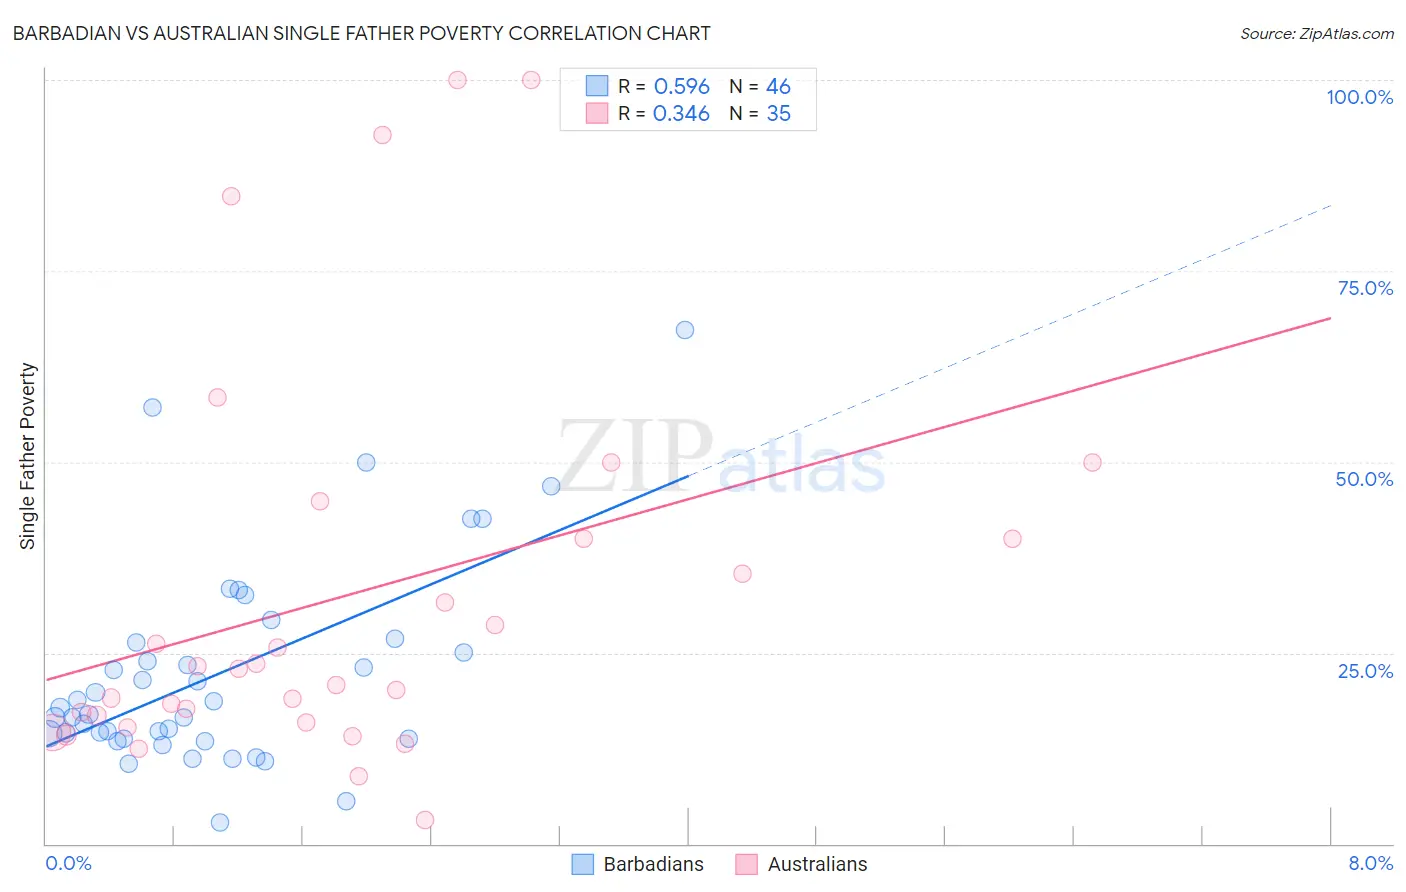
Barbadian vs Australian Single Father Poverty Correlation Chart
The statistical analysis conducted on geographies consisting of 128,228,135 people shows a substantial positive correlation between the proportion of Barbadians and poverty level among single fathers in the United States with a correlation coefficient (R) of 0.596 and weighted average of 17.5%. Similarly, the statistical analysis conducted on geographies consisting of 185,666,676 people shows a mild positive correlation between the proportion of Australians and poverty level among single fathers in the United States with a correlation coefficient (R) of 0.346 and weighted average of 15.7%, a difference of 11.3%.
Single Father Poverty Correlation Summary
| Measurement | Barbadian | Australian |
| Minimum | 2.8% | 3.1% |
| Maximum | 67.2% | 100.0% |
| Range | 64.4% | 96.9% |
| Mean | 22.3% | 32.5% |
| Median | 17.4% | 22.9% |
| Interquartile 25% (IQ1) | 13.7% | 15.8% |
| Interquartile 75% (IQ3) | 26.3% | 40.0% |
| Interquartile Range (IQR) | 12.6% | 24.2% |
| Standard Deviation (Sample) | 13.4% | 25.8% |
| Standard Deviation (Population) | 13.3% | 25.5% |
Similar Demographics by Single Father Poverty
Demographics Similar to Barbadians by Single Father Poverty
In terms of single father poverty, the demographic groups most similar to Barbadians are Italian (17.5%, a difference of 0.28%), French American Indian (17.4%, a difference of 0.35%), Indonesian (17.4%, a difference of 0.48%), Slavic (17.4%, a difference of 0.74%), and Immigrants from Caribbean (17.4%, a difference of 0.81%).
| Demographics | Rating | Rank | Single Father Poverty |
| Poles | 0.3 /100 | #265 | Tragic 17.3% |
| Jamaicans | 0.3 /100 | #266 | Tragic 17.3% |
| Haitians | 0.3 /100 | #267 | Tragic 17.3% |
| Immigrants | Caribbean | 0.3 /100 | #268 | Tragic 17.4% |
| Slavs | 0.3 /100 | #269 | Tragic 17.4% |
| Indonesians | 0.2 /100 | #270 | Tragic 17.4% |
| French American Indians | 0.2 /100 | #271 | Tragic 17.4% |
| Barbadians | 0.1 /100 | #272 | Tragic 17.5% |
| Italians | 0.1 /100 | #273 | Tragic 17.5% |
| Macedonians | 0.1 /100 | #274 | Tragic 17.7% |
| British West Indians | 0.0 /100 | #275 | Tragic 17.7% |
| German Russians | 0.0 /100 | #276 | Tragic 17.7% |
| Lebanese | 0.0 /100 | #277 | Tragic 17.7% |
| Germans | 0.0 /100 | #278 | Tragic 17.7% |
| Iroquois | 0.0 /100 | #279 | Tragic 17.7% |
Demographics Similar to Australians by Single Father Poverty
In terms of single father poverty, the demographic groups most similar to Australians are Immigrants from Australia (15.7%, a difference of 0.010%), South American Indian (15.7%, a difference of 0.020%), Chilean (15.7%, a difference of 0.080%), Immigrants from Poland (15.7%, a difference of 0.080%), and Native Hawaiian (15.7%, a difference of 0.10%).
| Demographics | Rating | Rank | Single Father Poverty |
| Yaqui | 98.1 /100 | #97 | Exceptional 15.6% |
| Zimbabweans | 98.1 /100 | #98 | Exceptional 15.6% |
| Immigrants | Middle Africa | 97.4 /100 | #99 | Exceptional 15.6% |
| Immigrants | Chile | 96.9 /100 | #100 | Exceptional 15.7% |
| Fijians | 96.8 /100 | #101 | Exceptional 15.7% |
| Chileans | 96.4 /100 | #102 | Exceptional 15.7% |
| South American Indians | 96.2 /100 | #103 | Exceptional 15.7% |
| Australians | 96.1 /100 | #104 | Exceptional 15.7% |
| Immigrants | Australia | 96.1 /100 | #105 | Exceptional 15.7% |
| Immigrants | Poland | 95.8 /100 | #106 | Exceptional 15.7% |
| Native Hawaiians | 95.8 /100 | #107 | Exceptional 15.7% |
| Pakistanis | 95.7 /100 | #108 | Exceptional 15.7% |
| Turks | 95.1 /100 | #109 | Exceptional 15.8% |
| Immigrants | Africa | 95.1 /100 | #110 | Exceptional 15.8% |
| Bulgarians | 94.8 /100 | #111 | Exceptional 15.8% |