Barbadian vs Immigrants from Senegal Female Unemployment
COMPARE
Barbadian
Immigrants from Senegal
Female Unemployment
Female Unemployment Comparison
Barbadians
Immigrants from Senegal
6.2%
FEMALE UNEMPLOYMENT
0.0/ 100
METRIC RATING
303rd/ 347
METRIC RANK
6.1%
FEMALE UNEMPLOYMENT
0.0/ 100
METRIC RATING
284th/ 347
METRIC RANK
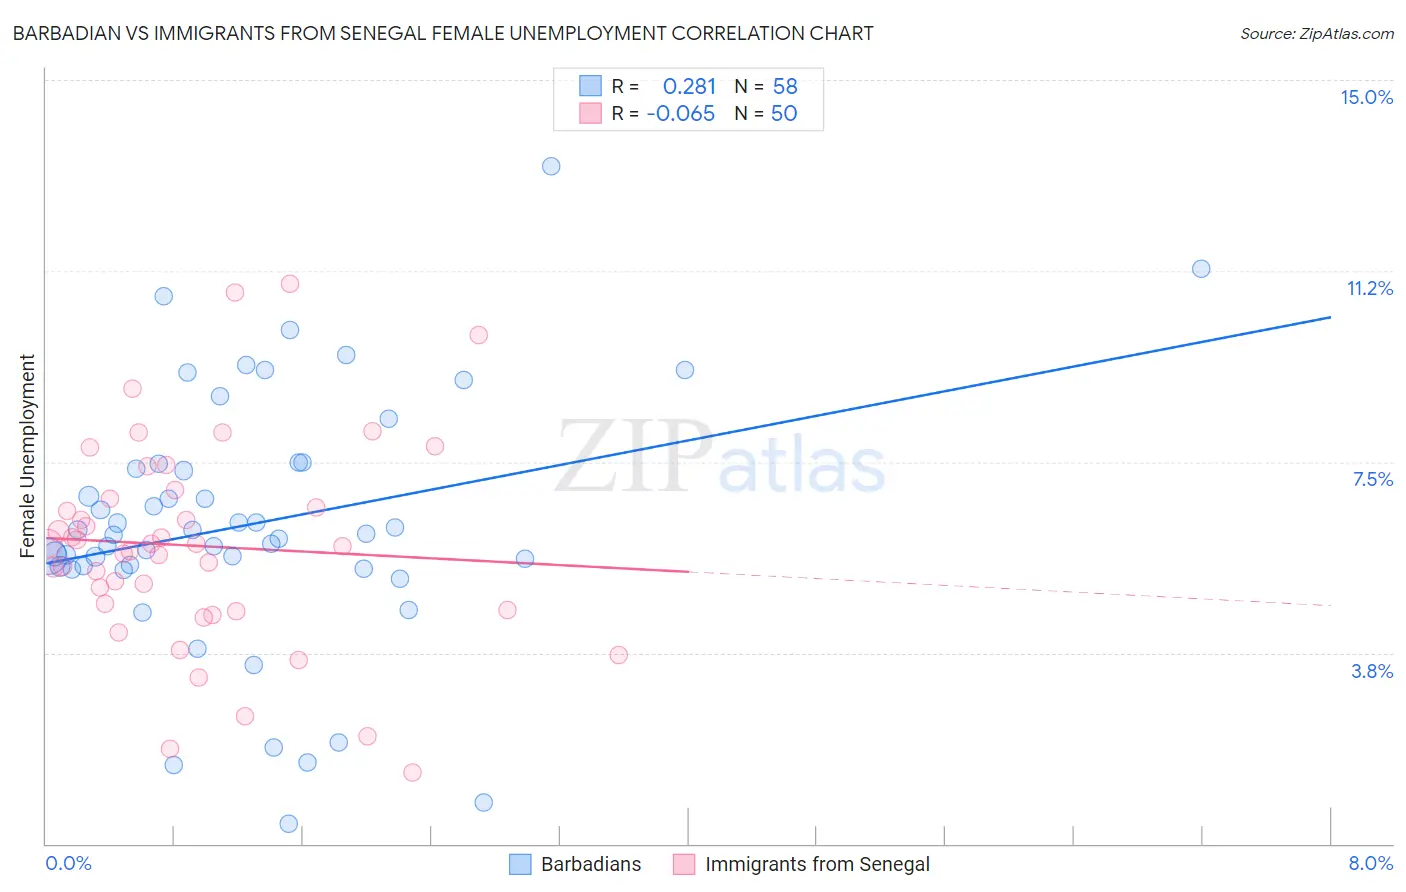
Barbadian vs Immigrants from Senegal Female Unemployment Correlation Chart
The statistical analysis conducted on geographies consisting of 141,186,778 people shows a weak positive correlation between the proportion of Barbadians and unemploymnet rate among females in the United States with a correlation coefficient (R) of 0.281 and weighted average of 6.2%. Similarly, the statistical analysis conducted on geographies consisting of 90,121,254 people shows a slight negative correlation between the proportion of Immigrants from Senegal and unemploymnet rate among females in the United States with a correlation coefficient (R) of -0.065 and weighted average of 6.1%, a difference of 2.2%.
Female Unemployment Correlation Summary
| Measurement | Barbadian | Immigrants from Senegal |
| Minimum | 0.40% | 1.4% |
| Maximum | 13.3% | 11.0% |
| Range | 12.9% | 9.6% |
| Mean | 6.3% | 5.8% |
| Median | 6.1% | 5.9% |
| Interquartile 25% (IQ1) | 5.4% | 4.6% |
| Interquartile 75% (IQ3) | 7.5% | 6.8% |
| Interquartile Range (IQR) | 2.0% | 2.2% |
| Standard Deviation (Sample) | 2.5% | 2.0% |
| Standard Deviation (Population) | 2.5% | 2.0% |
Demographics Similar to Barbadians and Immigrants from Senegal by Female Unemployment
In terms of female unemployment, the demographic groups most similar to Barbadians are U.S. Virgin Islander (6.2%, a difference of 0.34%), Immigrants from Barbados (6.2%, a difference of 0.50%), Immigrants from Haiti (6.1%, a difference of 0.95%), Ute (6.1%, a difference of 0.99%), and Jamaican (6.1%, a difference of 1.1%). Similarly, the demographic groups most similar to Immigrants from Senegal are Salvadoran (6.0%, a difference of 0.34%), Immigrants from Cabo Verde (6.1%, a difference of 0.38%), Chippewa (6.1%, a difference of 0.40%), Immigrants from Guatemala (6.1%, a difference of 0.43%), and Haitian (6.1%, a difference of 0.47%).
| Demographics | Rating | Rank | Female Unemployment |
| Salvadorans | 0.0 /100 | #283 | Tragic 6.0% |
| Immigrants | Senegal | 0.0 /100 | #284 | Tragic 6.1% |
| Immigrants | Cabo Verde | 0.0 /100 | #285 | Tragic 6.1% |
| Chippewa | 0.0 /100 | #286 | Tragic 6.1% |
| Immigrants | Guatemala | 0.0 /100 | #287 | Tragic 6.1% |
| Haitians | 0.0 /100 | #288 | Tragic 6.1% |
| Trinidadians and Tobagonians | 0.0 /100 | #289 | Tragic 6.1% |
| Immigrants | Caribbean | 0.0 /100 | #290 | Tragic 6.1% |
| Immigrants | West Indies | 0.0 /100 | #291 | Tragic 6.1% |
| Immigrants | Trinidad and Tobago | 0.0 /100 | #292 | Tragic 6.1% |
| Mexicans | 0.0 /100 | #293 | Tragic 6.1% |
| Immigrants | El Salvador | 0.0 /100 | #294 | Tragic 6.1% |
| Immigrants | Latin America | 0.0 /100 | #295 | Tragic 6.1% |
| Alaskan Athabascans | 0.0 /100 | #296 | Tragic 6.1% |
| West Indians | 0.0 /100 | #297 | Tragic 6.1% |
| Jamaicans | 0.0 /100 | #298 | Tragic 6.1% |
| Ute | 0.0 /100 | #299 | Tragic 6.1% |
| Immigrants | Haiti | 0.0 /100 | #300 | Tragic 6.1% |
| Immigrants | Barbados | 0.0 /100 | #301 | Tragic 6.2% |
| U.S. Virgin Islanders | 0.0 /100 | #302 | Tragic 6.2% |
| Barbadians | 0.0 /100 | #303 | Tragic 6.2% |