Barbadian vs Immigrants from Scotland Single Father Poverty
COMPARE
Barbadian
Immigrants from Scotland
Single Father Poverty
Single Father Poverty Comparison
Barbadians
Immigrants from Scotland
17.5%
SINGLE FATHER POVERTY
0.1/ 100
METRIC RATING
272nd/ 347
METRIC RANK
16.7%
SINGLE FATHER POVERTY
9.6/ 100
METRIC RATING
215th/ 347
METRIC RANK
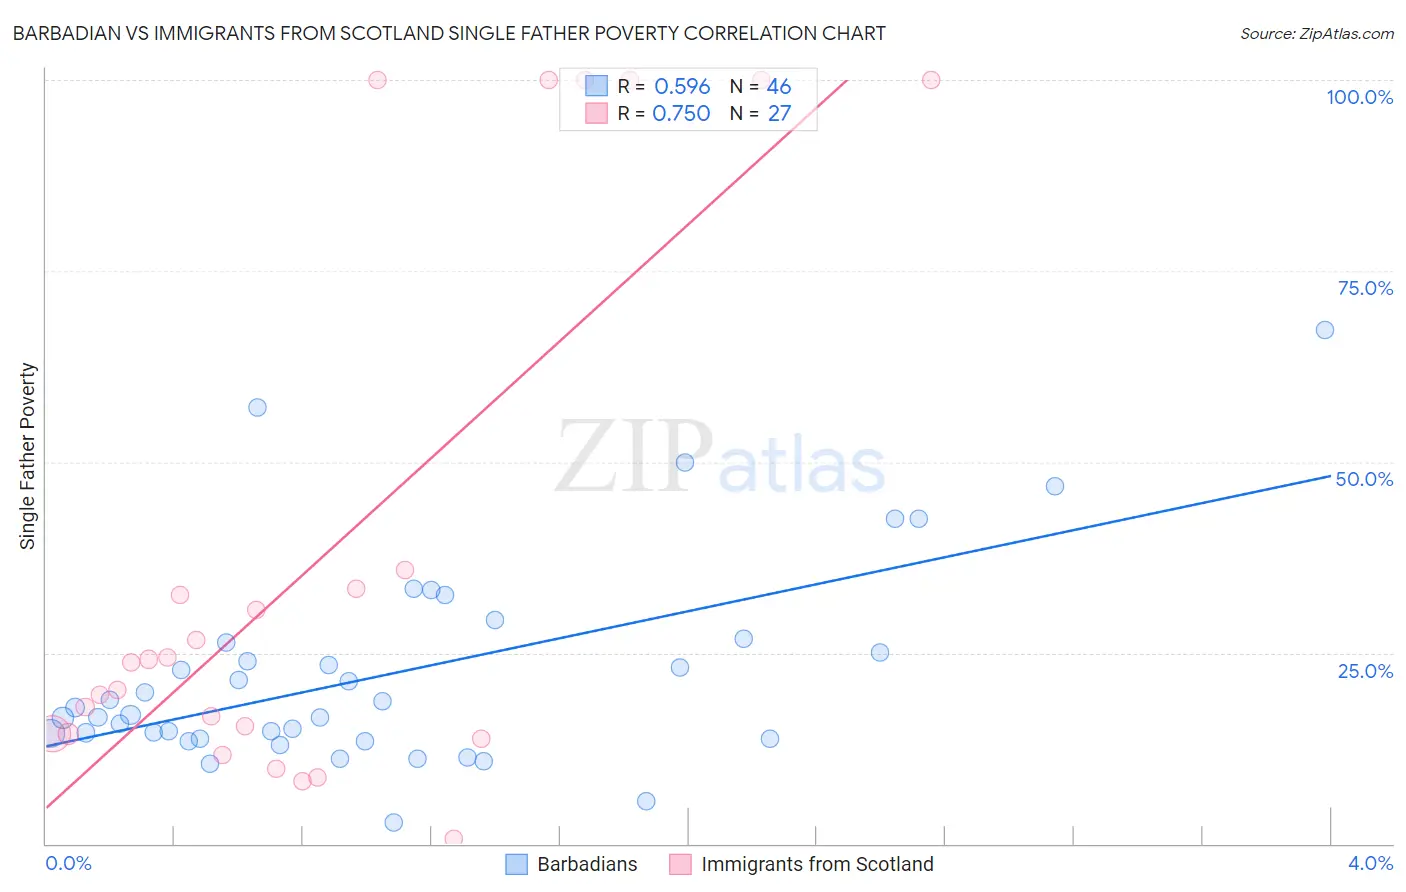
Barbadian vs Immigrants from Scotland Single Father Poverty Correlation Chart
The statistical analysis conducted on geographies consisting of 128,228,135 people shows a substantial positive correlation between the proportion of Barbadians and poverty level among single fathers in the United States with a correlation coefficient (R) of 0.596 and weighted average of 17.5%. Similarly, the statistical analysis conducted on geographies consisting of 163,789,782 people shows a strong positive correlation between the proportion of Immigrants from Scotland and poverty level among single fathers in the United States with a correlation coefficient (R) of 0.750 and weighted average of 16.7%, a difference of 4.8%.
Single Father Poverty Correlation Summary
| Measurement | Barbadian | Immigrants from Scotland |
| Minimum | 2.8% | 0.70% |
| Maximum | 67.2% | 100.0% |
| Range | 64.4% | 99.3% |
| Mean | 22.3% | 37.1% |
| Median | 17.4% | 23.7% |
| Interquartile 25% (IQ1) | 13.7% | 14.3% |
| Interquartile 75% (IQ3) | 26.3% | 35.9% |
| Interquartile Range (IQR) | 12.6% | 21.6% |
| Standard Deviation (Sample) | 13.4% | 35.2% |
| Standard Deviation (Population) | 13.3% | 34.6% |
Similar Demographics by Single Father Poverty
Demographics Similar to Barbadians by Single Father Poverty
In terms of single father poverty, the demographic groups most similar to Barbadians are Italian (17.5%, a difference of 0.28%), French American Indian (17.4%, a difference of 0.35%), Indonesian (17.4%, a difference of 0.48%), Slavic (17.4%, a difference of 0.74%), and Immigrants from Caribbean (17.4%, a difference of 0.81%).
| Demographics | Rating | Rank | Single Father Poverty |
| Poles | 0.3 /100 | #265 | Tragic 17.3% |
| Jamaicans | 0.3 /100 | #266 | Tragic 17.3% |
| Haitians | 0.3 /100 | #267 | Tragic 17.3% |
| Immigrants | Caribbean | 0.3 /100 | #268 | Tragic 17.4% |
| Slavs | 0.3 /100 | #269 | Tragic 17.4% |
| Indonesians | 0.2 /100 | #270 | Tragic 17.4% |
| French American Indians | 0.2 /100 | #271 | Tragic 17.4% |
| Barbadians | 0.1 /100 | #272 | Tragic 17.5% |
| Italians | 0.1 /100 | #273 | Tragic 17.5% |
| Macedonians | 0.1 /100 | #274 | Tragic 17.7% |
| British West Indians | 0.0 /100 | #275 | Tragic 17.7% |
| German Russians | 0.0 /100 | #276 | Tragic 17.7% |
| Lebanese | 0.0 /100 | #277 | Tragic 17.7% |
| Germans | 0.0 /100 | #278 | Tragic 17.7% |
| Iroquois | 0.0 /100 | #279 | Tragic 17.7% |
Demographics Similar to Immigrants from Scotland by Single Father Poverty
In terms of single father poverty, the demographic groups most similar to Immigrants from Scotland are Immigrants from England (16.7%, a difference of 0.0%), Cheyenne (16.7%, a difference of 0.030%), Spanish (16.7%, a difference of 0.13%), Immigrants from Uganda (16.7%, a difference of 0.13%), and Ghanaian (16.7%, a difference of 0.17%).
| Demographics | Rating | Rank | Single Father Poverty |
| Eastern Europeans | 13.7 /100 | #208 | Poor 16.6% |
| Europeans | 13.2 /100 | #209 | Poor 16.6% |
| Guatemalans | 12.9 /100 | #210 | Poor 16.6% |
| Arabs | 12.8 /100 | #211 | Poor 16.6% |
| Immigrants | Southern Europe | 11.2 /100 | #212 | Poor 16.7% |
| Ghanaians | 11.0 /100 | #213 | Poor 16.7% |
| Spanish | 10.7 /100 | #214 | Poor 16.7% |
| Immigrants | Scotland | 9.6 /100 | #215 | Tragic 16.7% |
| Immigrants | England | 9.5 /100 | #216 | Tragic 16.7% |
| Cheyenne | 9.3 /100 | #217 | Tragic 16.7% |
| Immigrants | Uganda | 8.6 /100 | #218 | Tragic 16.7% |
| Immigrants | Ghana | 8.1 /100 | #219 | Tragic 16.7% |
| Immigrants | Denmark | 8.1 /100 | #220 | Tragic 16.7% |
| Immigrants | Greece | 8.1 /100 | #221 | Tragic 16.7% |
| Immigrants | Spain | 8.0 /100 | #222 | Tragic 16.7% |