Subsaharan African vs Immigrants from Senegal Single Father Poverty
COMPARE
Subsaharan African
Immigrants from Senegal
Single Father Poverty
Single Father Poverty Comparison
Sub-Saharan Africans
Immigrants from Senegal
16.9%
SINGLE FATHER POVERTY
2.9/ 100
METRIC RATING
237th/ 347
METRIC RANK
16.6%
SINGLE FATHER POVERTY
13.7/ 100
METRIC RATING
206th/ 347
METRIC RANK
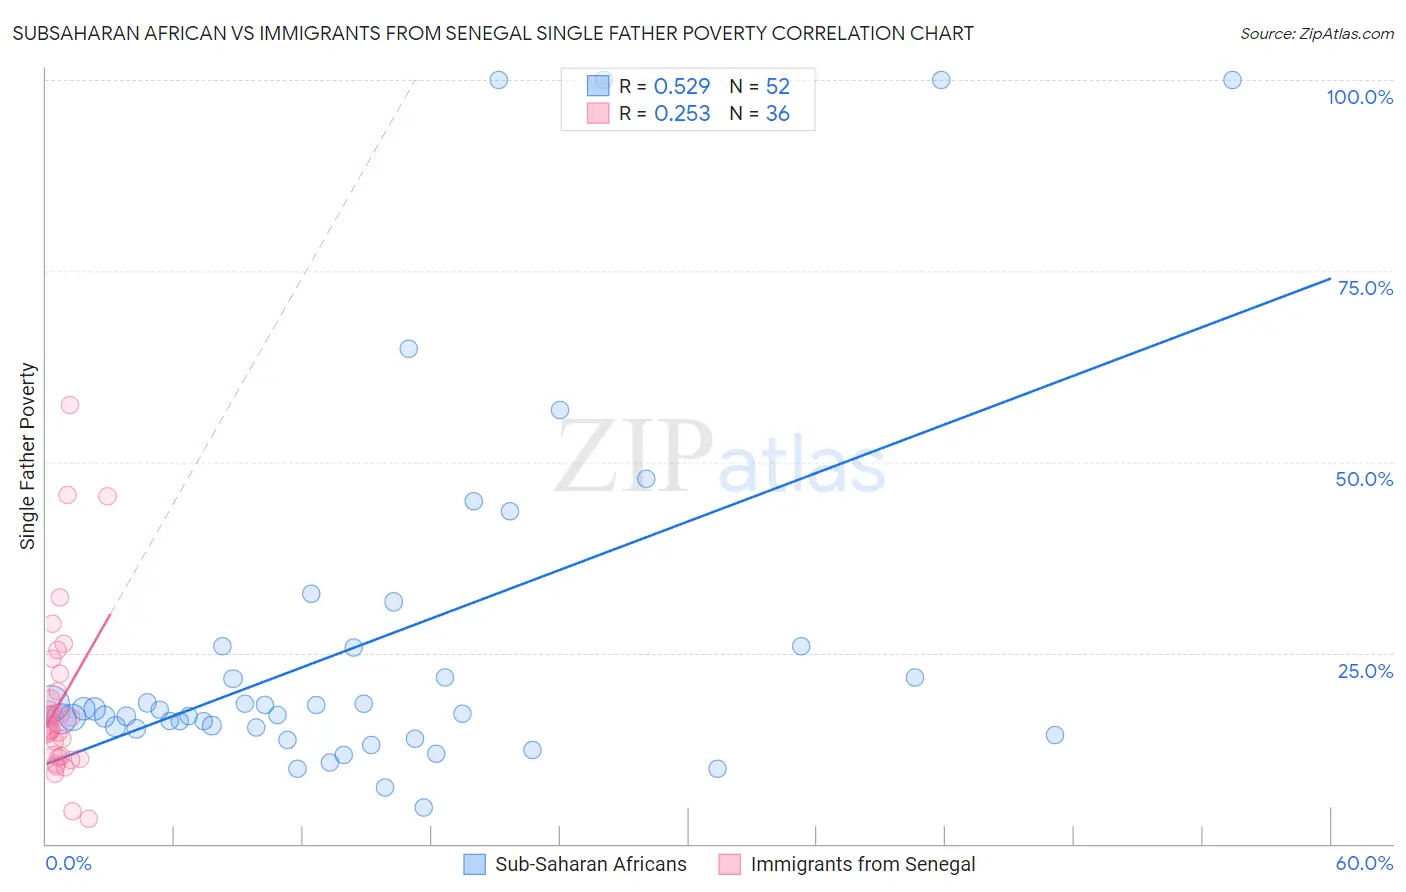
Subsaharan African vs Immigrants from Senegal Single Father Poverty Correlation Chart
The statistical analysis conducted on geographies consisting of 386,638,837 people shows a substantial positive correlation between the proportion of Sub-Saharan Africans and poverty level among single fathers in the United States with a correlation coefficient (R) of 0.529 and weighted average of 16.9%. Similarly, the statistical analysis conducted on geographies consisting of 83,824,522 people shows a weak positive correlation between the proportion of Immigrants from Senegal and poverty level among single fathers in the United States with a correlation coefficient (R) of 0.253 and weighted average of 16.6%, a difference of 1.8%.
Single Father Poverty Correlation Summary
| Measurement | Subsaharan African | Immigrants from Senegal |
| Minimum | 4.8% | 3.3% |
| Maximum | 100.0% | 57.4% |
| Range | 95.2% | 54.2% |
| Mean | 26.7% | 18.6% |
| Median | 17.3% | 15.4% |
| Interquartile 25% (IQ1) | 15.1% | 11.4% |
| Interquartile 75% (IQ3) | 25.8% | 21.1% |
| Interquartile Range (IQR) | 10.6% | 9.7% |
| Standard Deviation (Sample) | 24.4% | 11.4% |
| Standard Deviation (Population) | 24.1% | 11.3% |
Similar Demographics by Single Father Poverty
Demographics Similar to Sub-Saharan Africans by Single Father Poverty
In terms of single father poverty, the demographic groups most similar to Sub-Saharan Africans are Immigrants from Western Europe (16.9%, a difference of 0.0%), Immigrants from Germany (16.9%, a difference of 0.0%), Immigrants from Saudi Arabia (16.9%, a difference of 0.070%), Bermudan (16.9%, a difference of 0.090%), and Marshallese (16.9%, a difference of 0.10%).
| Demographics | Rating | Rank | Single Father Poverty |
| Immigrants | Trinidad and Tobago | 4.5 /100 | #230 | Tragic 16.8% |
| Spanish Americans | 3.7 /100 | #231 | Tragic 16.9% |
| Immigrants | Grenada | 3.7 /100 | #232 | Tragic 16.9% |
| Senegalese | 3.2 /100 | #233 | Tragic 16.9% |
| Marshallese | 3.1 /100 | #234 | Tragic 16.9% |
| Immigrants | Western Europe | 2.9 /100 | #235 | Tragic 16.9% |
| Immigrants | Germany | 2.9 /100 | #236 | Tragic 16.9% |
| Sub-Saharan Africans | 2.9 /100 | #237 | Tragic 16.9% |
| Immigrants | Saudi Arabia | 2.7 /100 | #238 | Tragic 16.9% |
| Bermudans | 2.6 /100 | #239 | Tragic 16.9% |
| Finns | 2.6 /100 | #240 | Tragic 16.9% |
| Czechs | 2.3 /100 | #241 | Tragic 17.0% |
| Moroccans | 2.1 /100 | #242 | Tragic 17.0% |
| Immigrants | Cabo Verde | 1.6 /100 | #243 | Tragic 17.0% |
| Hondurans | 1.6 /100 | #244 | Tragic 17.0% |
Demographics Similar to Immigrants from Senegal by Single Father Poverty
In terms of single father poverty, the demographic groups most similar to Immigrants from Senegal are New Zealander (16.6%, a difference of 0.0%), Eastern European (16.6%, a difference of 0.0%), Venezuelan (16.6%, a difference of 0.050%), European (16.6%, a difference of 0.050%), and Guatemalan (16.6%, a difference of 0.080%).
| Demographics | Rating | Rank | Single Father Poverty |
| Immigrants | Belize | 19.8 /100 | #199 | Poor 16.5% |
| Syrians | 17.4 /100 | #200 | Poor 16.6% |
| Cubans | 16.5 /100 | #201 | Poor 16.6% |
| Immigrants | Croatia | 16.5 /100 | #202 | Poor 16.6% |
| Immigrants | North America | 15.1 /100 | #203 | Poor 16.6% |
| Immigrants | Guatemala | 14.8 /100 | #204 | Poor 16.6% |
| Venezuelans | 14.3 /100 | #205 | Poor 16.6% |
| Immigrants | Senegal | 13.7 /100 | #206 | Poor 16.6% |
| New Zealanders | 13.7 /100 | #207 | Poor 16.6% |
| Eastern Europeans | 13.7 /100 | #208 | Poor 16.6% |
| Europeans | 13.2 /100 | #209 | Poor 16.6% |
| Guatemalans | 12.9 /100 | #210 | Poor 16.6% |
| Arabs | 12.8 /100 | #211 | Poor 16.6% |
| Immigrants | Southern Europe | 11.2 /100 | #212 | Poor 16.7% |
| Ghanaians | 11.0 /100 | #213 | Poor 16.7% |