Mexican American Indian vs Immigrants from Senegal Single Father Poverty
COMPARE
Mexican American Indian
Immigrants from Senegal
Single Father Poverty
Single Father Poverty Comparison
Mexican American Indians
Immigrants from Senegal
15.5%
SINGLE FATHER POVERTY
98.7/ 100
METRIC RATING
90th/ 347
METRIC RANK
16.6%
SINGLE FATHER POVERTY
13.7/ 100
METRIC RATING
206th/ 347
METRIC RANK
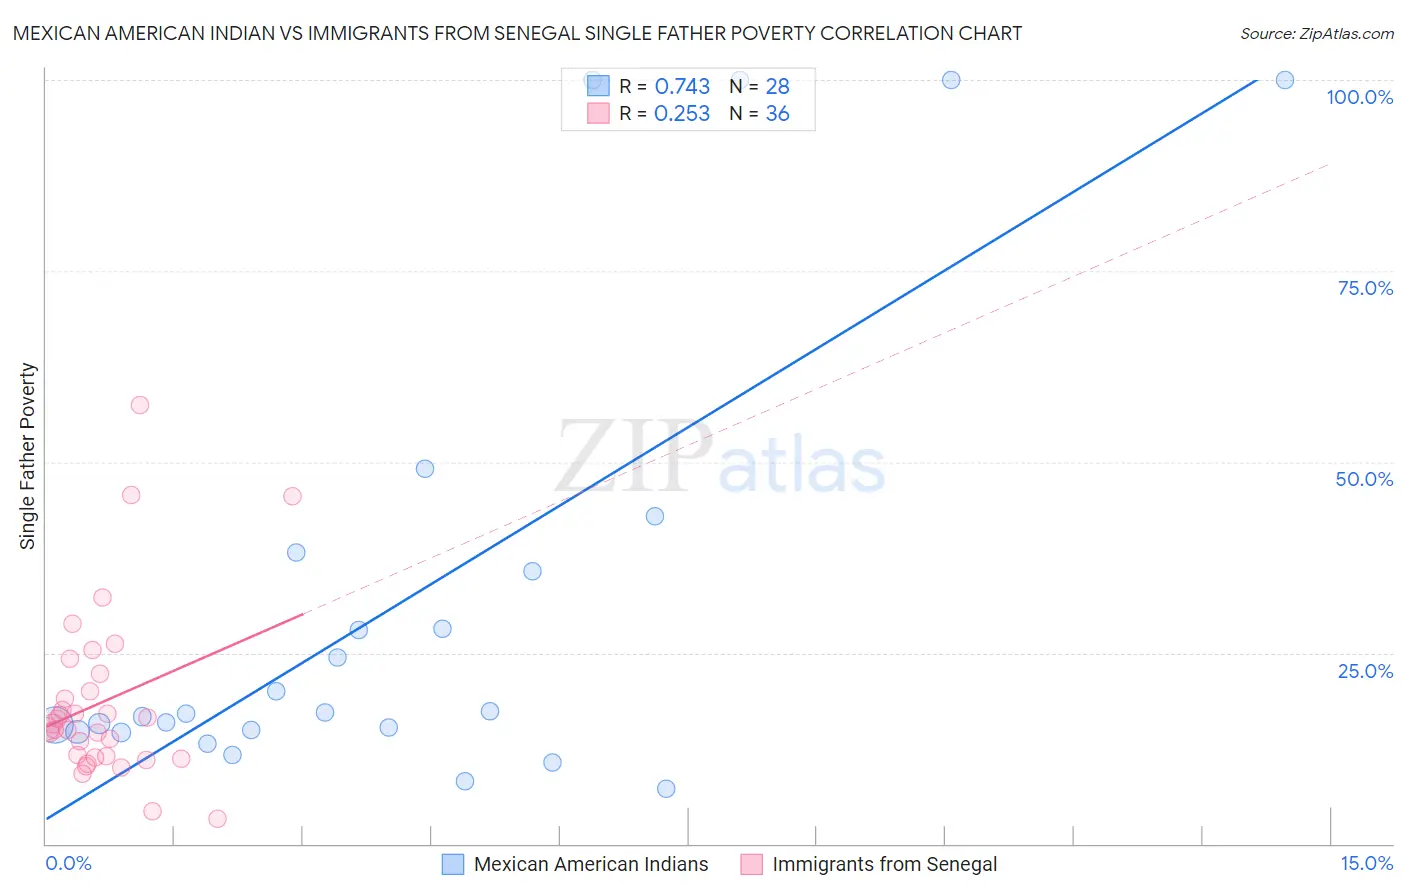
Mexican American Indian vs Immigrants from Senegal Single Father Poverty Correlation Chart
The statistical analysis conducted on geographies consisting of 266,902,883 people shows a strong positive correlation between the proportion of Mexican American Indians and poverty level among single fathers in the United States with a correlation coefficient (R) of 0.743 and weighted average of 15.5%. Similarly, the statistical analysis conducted on geographies consisting of 83,824,522 people shows a weak positive correlation between the proportion of Immigrants from Senegal and poverty level among single fathers in the United States with a correlation coefficient (R) of 0.253 and weighted average of 16.6%, a difference of 7.2%.
Single Father Poverty Correlation Summary
| Measurement | Mexican American Indian | Immigrants from Senegal |
| Minimum | 7.3% | 3.3% |
| Maximum | 100.0% | 57.4% |
| Range | 92.7% | 54.2% |
| Mean | 31.8% | 18.6% |
| Median | 17.1% | 15.4% |
| Interquartile 25% (IQ1) | 14.8% | 11.4% |
| Interquartile 75% (IQ3) | 36.9% | 21.1% |
| Interquartile Range (IQR) | 22.1% | 9.7% |
| Standard Deviation (Sample) | 30.1% | 11.4% |
| Standard Deviation (Population) | 29.6% | 11.3% |
Similar Demographics by Single Father Poverty
Demographics Similar to Mexican American Indians by Single Father Poverty
In terms of single father poverty, the demographic groups most similar to Mexican American Indians are Immigrants from Romania (15.5%, a difference of 0.10%), Immigrants from Serbia (15.5%, a difference of 0.21%), Immigrants from Korea (15.5%, a difference of 0.23%), Basque (15.5%, a difference of 0.25%), and Burmese (15.5%, a difference of 0.29%).
| Demographics | Rating | Rank | Single Father Poverty |
| Chinese | 99.3 /100 | #83 | Exceptional 15.4% |
| Peruvians | 99.2 /100 | #84 | Exceptional 15.4% |
| Immigrants | Oceania | 99.1 /100 | #85 | Exceptional 15.4% |
| Immigrants | Russia | 99.0 /100 | #86 | Exceptional 15.5% |
| Brazilians | 99.0 /100 | #87 | Exceptional 15.5% |
| Burmese | 99.0 /100 | #88 | Exceptional 15.5% |
| Immigrants | Korea | 99.0 /100 | #89 | Exceptional 15.5% |
| Mexican American Indians | 98.7 /100 | #90 | Exceptional 15.5% |
| Immigrants | Romania | 98.6 /100 | #91 | Exceptional 15.5% |
| Immigrants | Serbia | 98.5 /100 | #92 | Exceptional 15.5% |
| Basques | 98.4 /100 | #93 | Exceptional 15.5% |
| Immigrants | Uruguay | 98.2 /100 | #94 | Exceptional 15.6% |
| Immigrants | Kazakhstan | 98.2 /100 | #95 | Exceptional 15.6% |
| Immigrants | Belgium | 98.1 /100 | #96 | Exceptional 15.6% |
| Yaqui | 98.1 /100 | #97 | Exceptional 15.6% |
Demographics Similar to Immigrants from Senegal by Single Father Poverty
In terms of single father poverty, the demographic groups most similar to Immigrants from Senegal are New Zealander (16.6%, a difference of 0.0%), Eastern European (16.6%, a difference of 0.0%), Venezuelan (16.6%, a difference of 0.050%), European (16.6%, a difference of 0.050%), and Guatemalan (16.6%, a difference of 0.080%).
| Demographics | Rating | Rank | Single Father Poverty |
| Immigrants | Belize | 19.8 /100 | #199 | Poor 16.5% |
| Syrians | 17.4 /100 | #200 | Poor 16.6% |
| Cubans | 16.5 /100 | #201 | Poor 16.6% |
| Immigrants | Croatia | 16.5 /100 | #202 | Poor 16.6% |
| Immigrants | North America | 15.1 /100 | #203 | Poor 16.6% |
| Immigrants | Guatemala | 14.8 /100 | #204 | Poor 16.6% |
| Venezuelans | 14.3 /100 | #205 | Poor 16.6% |
| Immigrants | Senegal | 13.7 /100 | #206 | Poor 16.6% |
| New Zealanders | 13.7 /100 | #207 | Poor 16.6% |
| Eastern Europeans | 13.7 /100 | #208 | Poor 16.6% |
| Europeans | 13.2 /100 | #209 | Poor 16.6% |
| Guatemalans | 12.9 /100 | #210 | Poor 16.6% |
| Arabs | 12.8 /100 | #211 | Poor 16.6% |
| Immigrants | Southern Europe | 11.2 /100 | #212 | Poor 16.7% |
| Ghanaians | 11.0 /100 | #213 | Poor 16.7% |