Immigrants vs Immigrants from Senegal Single Father Poverty
COMPARE
Immigrants
Immigrants from Senegal
Single Father Poverty
Single Father Poverty Comparison
Immigrants
Immigrants from Senegal
15.9%
SINGLE FATHER POVERTY
91.9/ 100
METRIC RATING
121st/ 347
METRIC RANK
16.6%
SINGLE FATHER POVERTY
13.7/ 100
METRIC RATING
206th/ 347
METRIC RANK
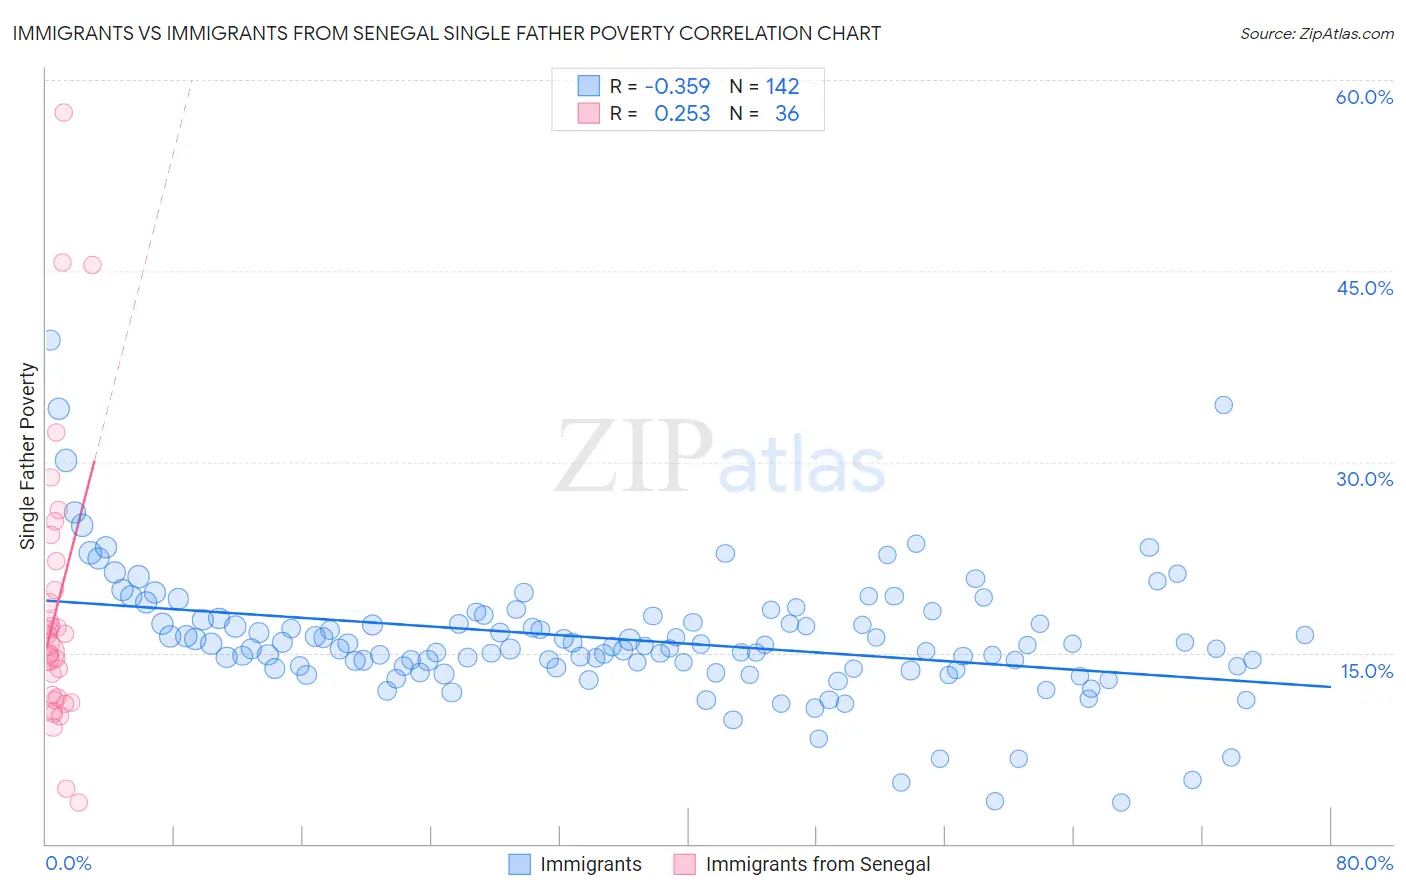
Immigrants vs Immigrants from Senegal Single Father Poverty Correlation Chart
The statistical analysis conducted on geographies consisting of 413,041,204 people shows a mild negative correlation between the proportion of Immigrants and poverty level among single fathers in the United States with a correlation coefficient (R) of -0.359 and weighted average of 15.9%. Similarly, the statistical analysis conducted on geographies consisting of 83,824,522 people shows a weak positive correlation between the proportion of Immigrants from Senegal and poverty level among single fathers in the United States with a correlation coefficient (R) of 0.253 and weighted average of 16.6%, a difference of 4.9%.
Single Father Poverty Correlation Summary
| Measurement | Immigrants | Immigrants from Senegal |
| Minimum | 3.3% | 3.3% |
| Maximum | 39.5% | 57.4% |
| Range | 36.3% | 54.2% |
| Mean | 16.0% | 18.6% |
| Median | 15.5% | 15.4% |
| Interquartile 25% (IQ1) | 13.9% | 11.4% |
| Interquartile 75% (IQ3) | 17.6% | 21.1% |
| Interquartile Range (IQR) | 3.8% | 9.7% |
| Standard Deviation (Sample) | 5.0% | 11.4% |
| Standard Deviation (Population) | 5.0% | 11.3% |
Similar Demographics by Single Father Poverty
Demographics Similar to Immigrants by Single Father Poverty
In terms of single father poverty, the demographic groups most similar to Immigrants are Uruguayan (15.9%, a difference of 0.020%), Sudanese (15.9%, a difference of 0.060%), Immigrants from Belarus (15.8%, a difference of 0.080%), Immigrants from Eastern Europe (15.8%, a difference of 0.090%), and Palestinian (15.9%, a difference of 0.10%).
| Demographics | Rating | Rank | Single Father Poverty |
| Argentineans | 94.4 /100 | #114 | Exceptional 15.8% |
| Immigrants | Thailand | 93.6 /100 | #115 | Exceptional 15.8% |
| Immigrants | Argentina | 92.8 /100 | #116 | Exceptional 15.8% |
| Immigrants | Colombia | 92.6 /100 | #117 | Exceptional 15.8% |
| Immigrants | Eastern Europe | 92.5 /100 | #118 | Exceptional 15.8% |
| Immigrants | Belarus | 92.4 /100 | #119 | Exceptional 15.8% |
| Uruguayans | 92.1 /100 | #120 | Exceptional 15.9% |
| Immigrants | Immigrants | 91.9 /100 | #121 | Exceptional 15.9% |
| Sudanese | 91.6 /100 | #122 | Exceptional 15.9% |
| Palestinians | 91.3 /100 | #123 | Exceptional 15.9% |
| Immigrants | Panama | 91.3 /100 | #124 | Exceptional 15.9% |
| Iraqis | 91.2 /100 | #125 | Exceptional 15.9% |
| Hmong | 91.1 /100 | #126 | Exceptional 15.9% |
| Immigrants | Liberia | 91.1 /100 | #127 | Exceptional 15.9% |
| Immigrants | Nigeria | 90.8 /100 | #128 | Exceptional 15.9% |
Demographics Similar to Immigrants from Senegal by Single Father Poverty
In terms of single father poverty, the demographic groups most similar to Immigrants from Senegal are New Zealander (16.6%, a difference of 0.0%), Eastern European (16.6%, a difference of 0.0%), Venezuelan (16.6%, a difference of 0.050%), European (16.6%, a difference of 0.050%), and Guatemalan (16.6%, a difference of 0.080%).
| Demographics | Rating | Rank | Single Father Poverty |
| Immigrants | Belize | 19.8 /100 | #199 | Poor 16.5% |
| Syrians | 17.4 /100 | #200 | Poor 16.6% |
| Cubans | 16.5 /100 | #201 | Poor 16.6% |
| Immigrants | Croatia | 16.5 /100 | #202 | Poor 16.6% |
| Immigrants | North America | 15.1 /100 | #203 | Poor 16.6% |
| Immigrants | Guatemala | 14.8 /100 | #204 | Poor 16.6% |
| Venezuelans | 14.3 /100 | #205 | Poor 16.6% |
| Immigrants | Senegal | 13.7 /100 | #206 | Poor 16.6% |
| New Zealanders | 13.7 /100 | #207 | Poor 16.6% |
| Eastern Europeans | 13.7 /100 | #208 | Poor 16.6% |
| Europeans | 13.2 /100 | #209 | Poor 16.6% |
| Guatemalans | 12.9 /100 | #210 | Poor 16.6% |
| Arabs | 12.8 /100 | #211 | Poor 16.6% |
| Immigrants | Southern Europe | 11.2 /100 | #212 | Poor 16.7% |
| Ghanaians | 11.0 /100 | #213 | Poor 16.7% |