Kiowa vs Immigrants from Norway Male Poverty
COMPARE
Kiowa
Immigrants from Norway
Male Poverty
Male Poverty Comparison
Kiowa
Immigrants from Norway
15.2%
MALE POVERTY
0.0/ 100
METRIC RATING
322nd/ 347
METRIC RANK
10.7%
MALE POVERTY
86.0/ 100
METRIC RATING
125th/ 347
METRIC RANK
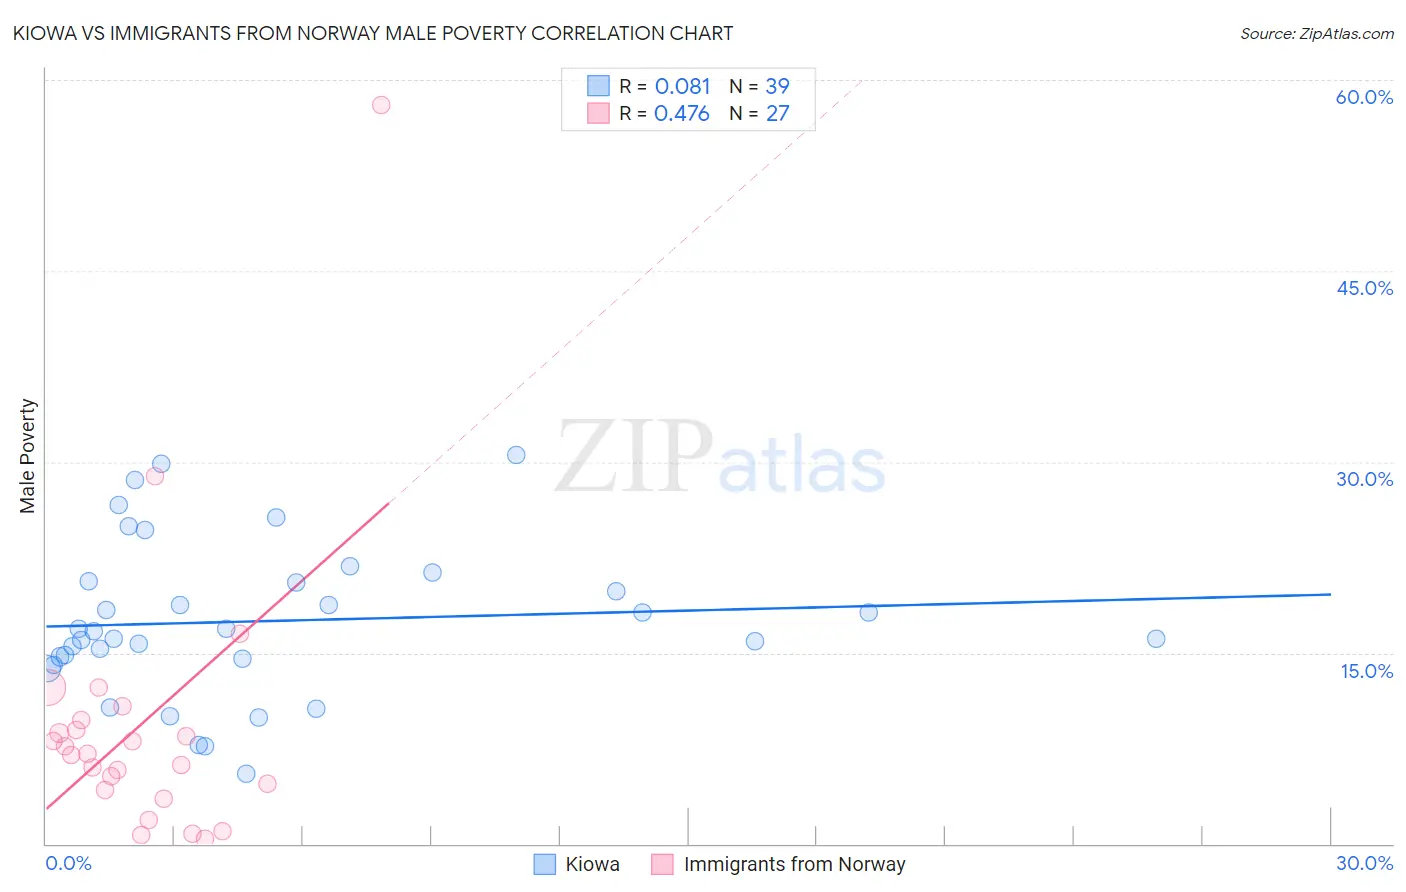
Kiowa vs Immigrants from Norway Male Poverty Correlation Chart
The statistical analysis conducted on geographies consisting of 56,098,824 people shows a slight positive correlation between the proportion of Kiowa and poverty level among males in the United States with a correlation coefficient (R) of 0.081 and weighted average of 15.2%. Similarly, the statistical analysis conducted on geographies consisting of 116,684,379 people shows a moderate positive correlation between the proportion of Immigrants from Norway and poverty level among males in the United States with a correlation coefficient (R) of 0.476 and weighted average of 10.7%, a difference of 42.1%.
Male Poverty Correlation Summary
| Measurement | Kiowa | Immigrants from Norway |
| Minimum | 5.5% | 0.44% |
| Maximum | 30.5% | 58.1% |
| Range | 25.0% | 57.6% |
| Mean | 17.5% | 9.4% |
| Median | 16.7% | 7.1% |
| Interquartile 25% (IQ1) | 14.6% | 4.2% |
| Interquartile 75% (IQ3) | 20.6% | 9.7% |
| Interquartile Range (IQR) | 6.0% | 5.6% |
| Standard Deviation (Sample) | 6.0% | 11.3% |
| Standard Deviation (Population) | 5.9% | 11.1% |
Similar Demographics by Male Poverty
Demographics Similar to Kiowa by Male Poverty
In terms of male poverty, the demographic groups most similar to Kiowa are Colville (15.2%, a difference of 0.39%), Menominee (15.3%, a difference of 0.58%), Arapaho (15.1%, a difference of 0.72%), Yakama (15.3%, a difference of 0.76%), and Central American Indian (15.3%, a difference of 0.87%).
| Demographics | Rating | Rank | Male Poverty |
| Chippewa | 0.0 /100 | #315 | Tragic 14.6% |
| British West Indians | 0.0 /100 | #316 | Tragic 14.6% |
| Immigrants | Dominica | 0.0 /100 | #317 | Tragic 14.7% |
| Immigrants | Grenada | 0.0 /100 | #318 | Tragic 14.7% |
| U.S. Virgin Islanders | 0.0 /100 | #319 | Tragic 14.7% |
| Immigrants | Congo | 0.0 /100 | #320 | Tragic 14.7% |
| Arapaho | 0.0 /100 | #321 | Tragic 15.1% |
| Kiowa | 0.0 /100 | #322 | Tragic 15.2% |
| Colville | 0.0 /100 | #323 | Tragic 15.2% |
| Menominee | 0.0 /100 | #324 | Tragic 15.3% |
| Yakama | 0.0 /100 | #325 | Tragic 15.3% |
| Central American Indians | 0.0 /100 | #326 | Tragic 15.3% |
| Paiute | 0.0 /100 | #327 | Tragic 15.8% |
| Blacks/African Americans | 0.0 /100 | #328 | Tragic 15.8% |
| Dominicans | 0.0 /100 | #329 | Tragic 16.1% |
Demographics Similar to Immigrants from Norway by Male Poverty
In terms of male poverty, the demographic groups most similar to Immigrants from Norway are French (10.7%, a difference of 0.15%), South African (10.7%, a difference of 0.18%), Native Hawaiian (10.7%, a difference of 0.22%), Peruvian (10.7%, a difference of 0.23%), and Immigrants from China (10.7%, a difference of 0.25%).
| Demographics | Rating | Rank | Male Poverty |
| Okinawans | 87.6 /100 | #118 | Excellent 10.7% |
| Immigrants | Hungary | 87.6 /100 | #119 | Excellent 10.7% |
| Immigrants | China | 87.1 /100 | #120 | Excellent 10.7% |
| Peruvians | 87.1 /100 | #121 | Excellent 10.7% |
| Native Hawaiians | 87.0 /100 | #122 | Excellent 10.7% |
| South Africans | 86.8 /100 | #123 | Excellent 10.7% |
| French | 86.7 /100 | #124 | Excellent 10.7% |
| Immigrants | Norway | 86.0 /100 | #125 | Excellent 10.7% |
| Immigrants | Ukraine | 84.3 /100 | #126 | Excellent 10.7% |
| Puget Sound Salish | 84.3 /100 | #127 | Excellent 10.7% |
| Immigrants | Western Europe | 84.2 /100 | #128 | Excellent 10.7% |
| Immigrants | Peru | 84.1 /100 | #129 | Excellent 10.7% |
| Chileans | 83.9 /100 | #130 | Excellent 10.7% |
| Immigrants | Belarus | 83.3 /100 | #131 | Excellent 10.7% |
| Immigrants | Vietnam | 83.0 /100 | #132 | Excellent 10.8% |