Barbadian vs Immigrants from Nicaragua Seniors Poverty Over the Age of 65
COMPARE
Barbadian
Immigrants from Nicaragua
Seniors Poverty Over the Age of 65
Seniors Poverty Over the Age of 65 Comparison
Barbadians
Immigrants from Nicaragua
14.4%
SENIORS POVERTY OVER THE AGE OF 65
0.0/ 100
METRIC RATING
313th/ 347
METRIC RANK
15.9%
SENIORS POVERTY OVER THE AGE OF 65
0.0/ 100
METRIC RATING
334th/ 347
METRIC RANK
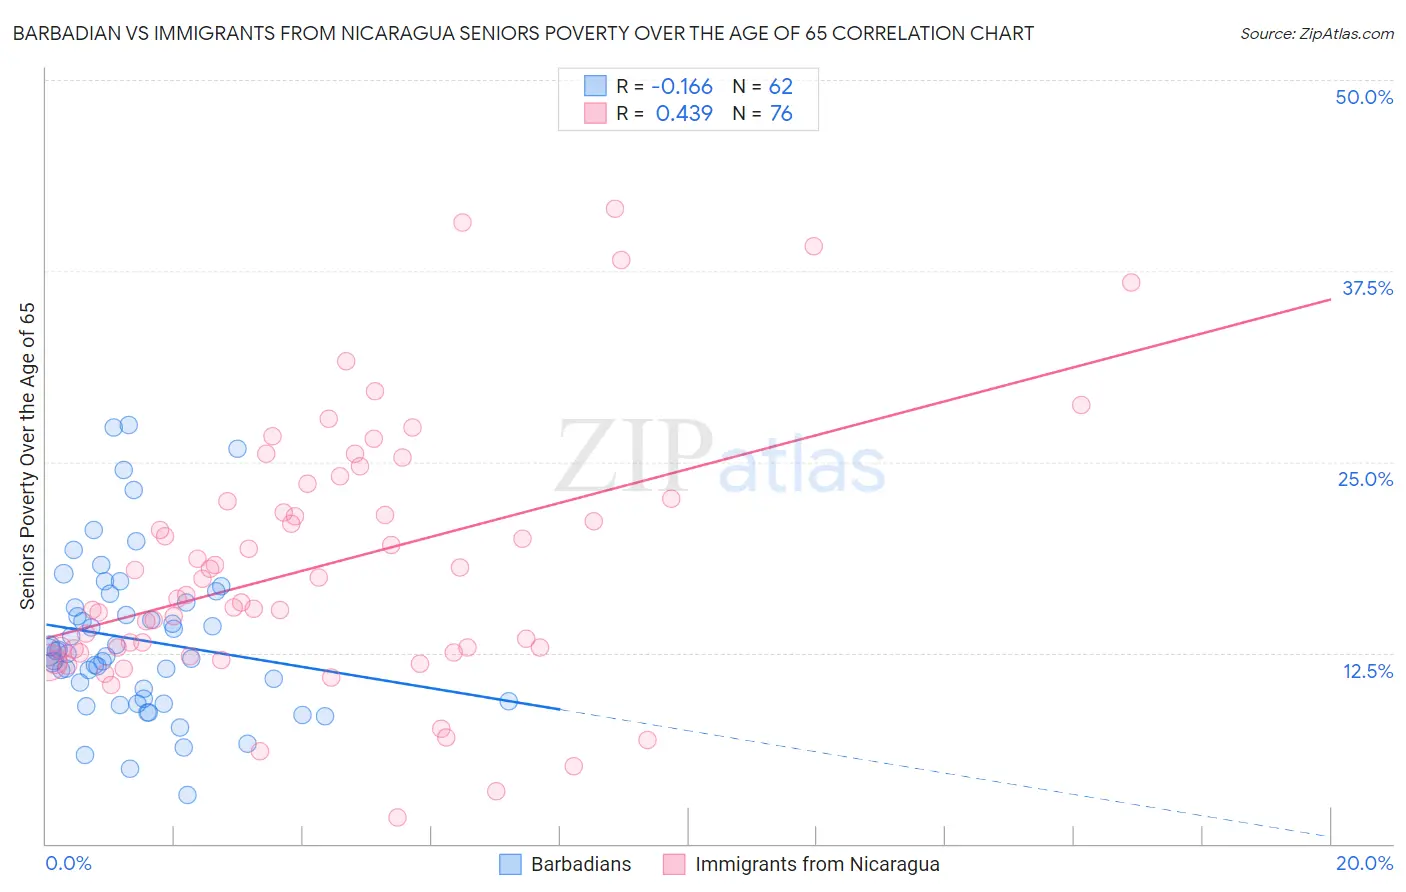
Barbadian vs Immigrants from Nicaragua Seniors Poverty Over the Age of 65 Correlation Chart
The statistical analysis conducted on geographies consisting of 141,112,181 people shows a poor negative correlation between the proportion of Barbadians and poverty level among seniors over the age of 65 in the United States with a correlation coefficient (R) of -0.166 and weighted average of 14.4%. Similarly, the statistical analysis conducted on geographies consisting of 236,090,448 people shows a moderate positive correlation between the proportion of Immigrants from Nicaragua and poverty level among seniors over the age of 65 in the United States with a correlation coefficient (R) of 0.439 and weighted average of 15.9%, a difference of 10.7%.
Seniors Poverty Over the Age of 65 Correlation Summary
| Measurement | Barbadian | Immigrants from Nicaragua |
| Minimum | 3.2% | 1.7% |
| Maximum | 27.4% | 41.6% |
| Range | 24.2% | 39.9% |
| Mean | 13.4% | 18.2% |
| Median | 12.5% | 16.2% |
| Interquartile 25% (IQ1) | 9.5% | 12.6% |
| Interquartile 75% (IQ3) | 15.8% | 22.5% |
| Interquartile Range (IQR) | 6.3% | 9.9% |
| Standard Deviation (Sample) | 5.2% | 8.5% |
| Standard Deviation (Population) | 5.1% | 8.4% |
Similar Demographics by Seniors Poverty Over the Age of 65
Demographics Similar to Barbadians by Seniors Poverty Over the Age of 65
In terms of seniors poverty over the age of 65, the demographic groups most similar to Barbadians are Hispanic or Latino (14.3%, a difference of 0.37%), Guyanese (14.4%, a difference of 0.39%), Immigrants from Ecuador (14.4%, a difference of 0.43%), Immigrants from Guyana (14.5%, a difference of 0.64%), and Haitian (14.5%, a difference of 0.67%).
| Demographics | Rating | Rank | Seniors Poverty Over the Age of 65 |
| Immigrants | Latin America | 0.0 /100 | #306 | Tragic 14.2% |
| Immigrants | West Indies | 0.0 /100 | #307 | Tragic 14.2% |
| Trinidadians and Tobagonians | 0.0 /100 | #308 | Tragic 14.2% |
| Hondurans | 0.0 /100 | #309 | Tragic 14.2% |
| Bahamians | 0.0 /100 | #310 | Tragic 14.2% |
| Natives/Alaskans | 0.0 /100 | #311 | Tragic 14.2% |
| Hispanics or Latinos | 0.0 /100 | #312 | Tragic 14.3% |
| Barbadians | 0.0 /100 | #313 | Tragic 14.4% |
| Guyanese | 0.0 /100 | #314 | Tragic 14.4% |
| Immigrants | Ecuador | 0.0 /100 | #315 | Tragic 14.4% |
| Immigrants | Guyana | 0.0 /100 | #316 | Tragic 14.5% |
| Haitians | 0.0 /100 | #317 | Tragic 14.5% |
| Immigrants | Honduras | 0.0 /100 | #318 | Tragic 14.5% |
| Cape Verdeans | 0.0 /100 | #319 | Tragic 14.7% |
| Immigrants | Haiti | 0.0 /100 | #320 | Tragic 14.7% |
Demographics Similar to Immigrants from Nicaragua by Seniors Poverty Over the Age of 65
In terms of seniors poverty over the age of 65, the demographic groups most similar to Immigrants from Nicaragua are Immigrants from Yemen (15.9%, a difference of 0.15%), Immigrants from Grenada (15.8%, a difference of 0.58%), Cuban (16.1%, a difference of 1.3%), Immigrants from Cabo Verde (16.2%, a difference of 1.8%), and British West Indian (15.6%, a difference of 2.0%).
| Demographics | Rating | Rank | Seniors Poverty Over the Age of 65 |
| Crow | 0.0 /100 | #327 | Tragic 15.2% |
| Sioux | 0.0 /100 | #328 | Tragic 15.3% |
| Immigrants | Dominica | 0.0 /100 | #329 | Tragic 15.5% |
| Immigrants | St. Vincent and the Grenadines | 0.0 /100 | #330 | Tragic 15.5% |
| British West Indians | 0.0 /100 | #331 | Tragic 15.6% |
| Immigrants | Grenada | 0.0 /100 | #332 | Tragic 15.8% |
| Immigrants | Yemen | 0.0 /100 | #333 | Tragic 15.9% |
| Immigrants | Nicaragua | 0.0 /100 | #334 | Tragic 15.9% |
| Cubans | 0.0 /100 | #335 | Tragic 16.1% |
| Immigrants | Cabo Verde | 0.0 /100 | #336 | Tragic 16.2% |
| Immigrants | Caribbean | 0.0 /100 | #337 | Tragic 16.5% |
| Pueblo | 0.0 /100 | #338 | Tragic 17.2% |
| Navajo | 0.0 /100 | #339 | Tragic 17.5% |
| Hopi | 0.0 /100 | #340 | Tragic 17.8% |
| Dominicans | 0.0 /100 | #341 | Tragic 17.8% |