Barbadian vs Immigrants from Southern Europe Seniors Poverty Over the Age of 65
COMPARE
Barbadian
Immigrants from Southern Europe
Seniors Poverty Over the Age of 65
Seniors Poverty Over the Age of 65 Comparison
Barbadians
Immigrants from Southern Europe
14.4%
SENIORS POVERTY OVER THE AGE OF 65
0.0/ 100
METRIC RATING
313th/ 347
METRIC RANK
11.1%
SENIORS POVERTY OVER THE AGE OF 65
30.1/ 100
METRIC RATING
192nd/ 347
METRIC RANK
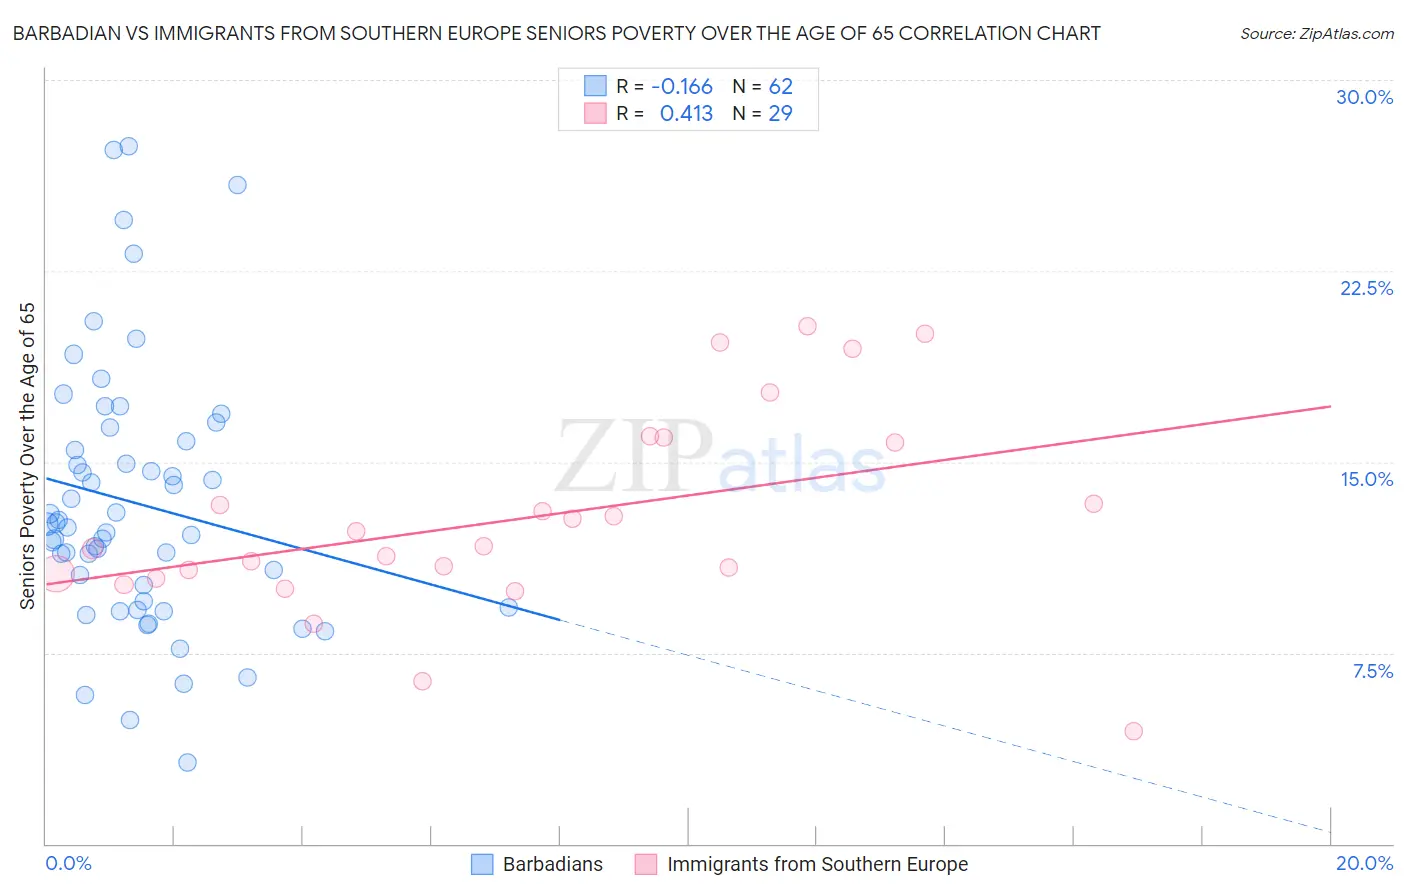
Barbadian vs Immigrants from Southern Europe Seniors Poverty Over the Age of 65 Correlation Chart
The statistical analysis conducted on geographies consisting of 141,112,181 people shows a poor negative correlation between the proportion of Barbadians and poverty level among seniors over the age of 65 in the United States with a correlation coefficient (R) of -0.166 and weighted average of 14.4%. Similarly, the statistical analysis conducted on geographies consisting of 401,547,314 people shows a moderate positive correlation between the proportion of Immigrants from Southern Europe and poverty level among seniors over the age of 65 in the United States with a correlation coefficient (R) of 0.413 and weighted average of 11.1%, a difference of 29.0%.
Seniors Poverty Over the Age of 65 Correlation Summary
| Measurement | Barbadian | Immigrants from Southern Europe |
| Minimum | 3.2% | 4.4% |
| Maximum | 27.4% | 20.3% |
| Range | 24.2% | 15.9% |
| Mean | 13.4% | 12.8% |
| Median | 12.5% | 11.7% |
| Interquartile 25% (IQ1) | 9.5% | 10.5% |
| Interquartile 75% (IQ3) | 15.8% | 15.8% |
| Interquartile Range (IQR) | 6.3% | 5.3% |
| Standard Deviation (Sample) | 5.2% | 3.9% |
| Standard Deviation (Population) | 5.1% | 3.9% |
Similar Demographics by Seniors Poverty Over the Age of 65
Demographics Similar to Barbadians by Seniors Poverty Over the Age of 65
In terms of seniors poverty over the age of 65, the demographic groups most similar to Barbadians are Hispanic or Latino (14.3%, a difference of 0.37%), Guyanese (14.4%, a difference of 0.39%), Immigrants from Ecuador (14.4%, a difference of 0.43%), Immigrants from Guyana (14.5%, a difference of 0.64%), and Haitian (14.5%, a difference of 0.67%).
| Demographics | Rating | Rank | Seniors Poverty Over the Age of 65 |
| Immigrants | Latin America | 0.0 /100 | #306 | Tragic 14.2% |
| Immigrants | West Indies | 0.0 /100 | #307 | Tragic 14.2% |
| Trinidadians and Tobagonians | 0.0 /100 | #308 | Tragic 14.2% |
| Hondurans | 0.0 /100 | #309 | Tragic 14.2% |
| Bahamians | 0.0 /100 | #310 | Tragic 14.2% |
| Natives/Alaskans | 0.0 /100 | #311 | Tragic 14.2% |
| Hispanics or Latinos | 0.0 /100 | #312 | Tragic 14.3% |
| Barbadians | 0.0 /100 | #313 | Tragic 14.4% |
| Guyanese | 0.0 /100 | #314 | Tragic 14.4% |
| Immigrants | Ecuador | 0.0 /100 | #315 | Tragic 14.4% |
| Immigrants | Guyana | 0.0 /100 | #316 | Tragic 14.5% |
| Haitians | 0.0 /100 | #317 | Tragic 14.5% |
| Immigrants | Honduras | 0.0 /100 | #318 | Tragic 14.5% |
| Cape Verdeans | 0.0 /100 | #319 | Tragic 14.7% |
| Immigrants | Haiti | 0.0 /100 | #320 | Tragic 14.7% |
Demographics Similar to Immigrants from Southern Europe by Seniors Poverty Over the Age of 65
In terms of seniors poverty over the age of 65, the demographic groups most similar to Immigrants from Southern Europe are Taiwanese (11.2%, a difference of 0.090%), Immigrants from Uganda (11.1%, a difference of 0.22%), Chilean (11.2%, a difference of 0.24%), Immigrants from Vietnam (11.2%, a difference of 0.37%), and Indian (Asian) (11.1%, a difference of 0.42%).
| Demographics | Rating | Rank | Seniors Poverty Over the Age of 65 |
| Immigrants | Lebanon | 38.2 /100 | #185 | Fair 11.1% |
| Immigrants | Eastern Asia | 37.5 /100 | #186 | Fair 11.1% |
| Immigrants | Middle Africa | 37.4 /100 | #187 | Fair 11.1% |
| Immigrants | Hong Kong | 36.3 /100 | #188 | Fair 11.1% |
| Immigrants | Laos | 35.7 /100 | #189 | Fair 11.1% |
| Indians (Asian) | 34.2 /100 | #190 | Fair 11.1% |
| Immigrants | Uganda | 32.2 /100 | #191 | Fair 11.1% |
| Immigrants | Southern Europe | 30.1 /100 | #192 | Fair 11.1% |
| Taiwanese | 29.2 /100 | #193 | Fair 11.2% |
| Chileans | 27.8 /100 | #194 | Fair 11.2% |
| Immigrants | Vietnam | 26.6 /100 | #195 | Fair 11.2% |
| Bangladeshis | 25.2 /100 | #196 | Fair 11.2% |
| Albanians | 24.4 /100 | #197 | Fair 11.2% |
| Immigrants | Burma/Myanmar | 21.3 /100 | #198 | Fair 11.3% |
| Immigrants | Israel | 20.3 /100 | #199 | Fair 11.3% |