Barbadian vs Cambodian Seniors Poverty Over the Age of 65
COMPARE
Barbadian
Cambodian
Seniors Poverty Over the Age of 65
Seniors Poverty Over the Age of 65 Comparison
Barbadians
Cambodians
14.4%
SENIORS POVERTY OVER THE AGE OF 65
0.0/ 100
METRIC RATING
313th/ 347
METRIC RANK
10.4%
SENIORS POVERTY OVER THE AGE OF 65
89.1/ 100
METRIC RATING
127th/ 347
METRIC RANK
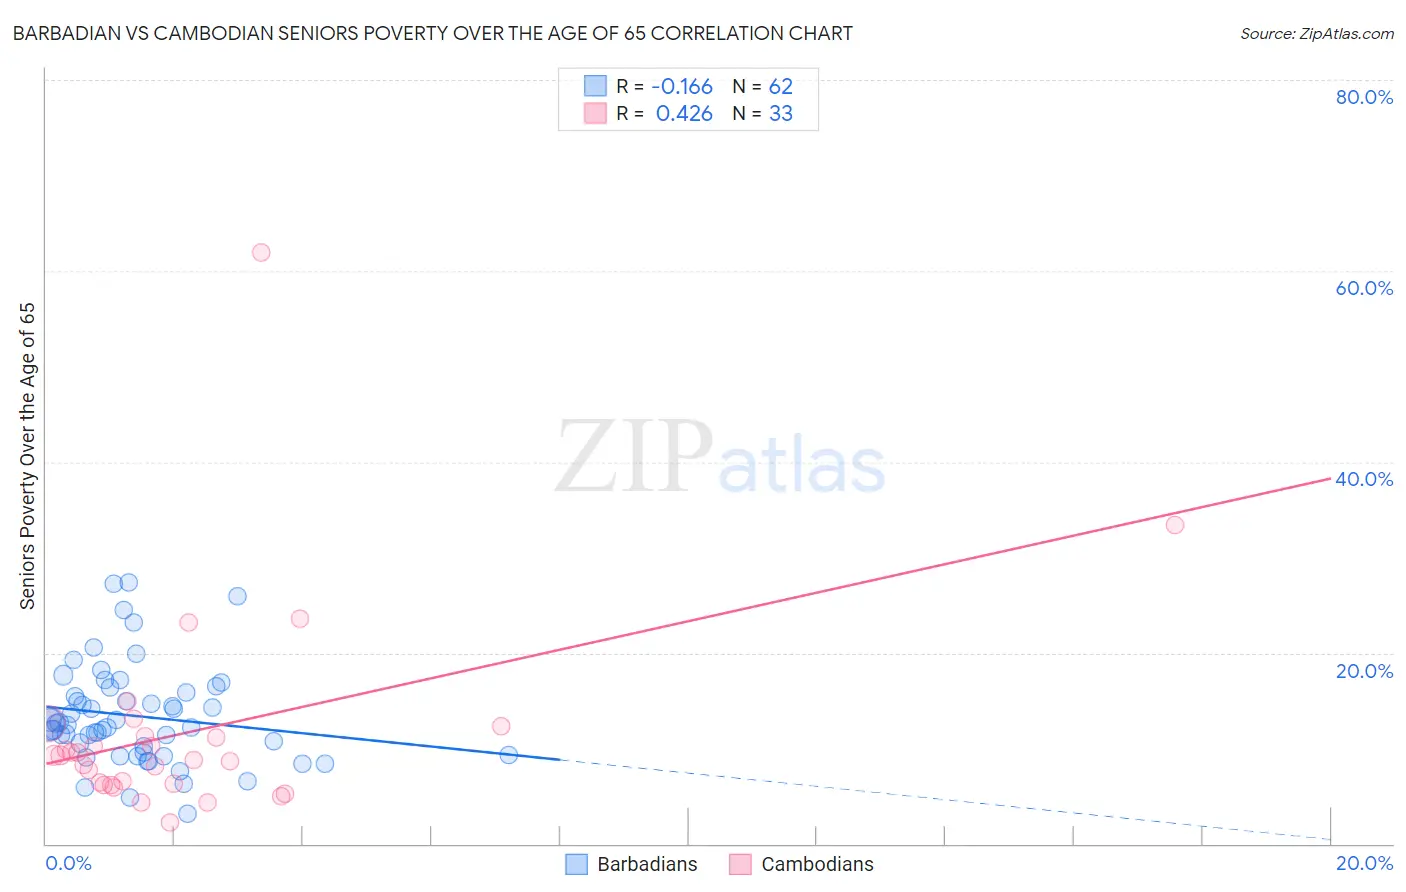
Barbadian vs Cambodian Seniors Poverty Over the Age of 65 Correlation Chart
The statistical analysis conducted on geographies consisting of 141,112,181 people shows a poor negative correlation between the proportion of Barbadians and poverty level among seniors over the age of 65 in the United States with a correlation coefficient (R) of -0.166 and weighted average of 14.4%. Similarly, the statistical analysis conducted on geographies consisting of 102,369,516 people shows a moderate positive correlation between the proportion of Cambodians and poverty level among seniors over the age of 65 in the United States with a correlation coefficient (R) of 0.426 and weighted average of 10.4%, a difference of 37.8%.
Seniors Poverty Over the Age of 65 Correlation Summary
| Measurement | Barbadian | Cambodian |
| Minimum | 3.2% | 2.3% |
| Maximum | 27.4% | 61.9% |
| Range | 24.2% | 59.7% |
| Mean | 13.4% | 11.7% |
| Median | 12.5% | 9.3% |
| Interquartile 25% (IQ1) | 9.5% | 6.2% |
| Interquartile 75% (IQ3) | 15.8% | 11.8% |
| Interquartile Range (IQR) | 6.3% | 5.6% |
| Standard Deviation (Sample) | 5.2% | 10.9% |
| Standard Deviation (Population) | 5.1% | 10.8% |
Similar Demographics by Seniors Poverty Over the Age of 65
Demographics Similar to Barbadians by Seniors Poverty Over the Age of 65
In terms of seniors poverty over the age of 65, the demographic groups most similar to Barbadians are Hispanic or Latino (14.3%, a difference of 0.37%), Guyanese (14.4%, a difference of 0.39%), Immigrants from Ecuador (14.4%, a difference of 0.43%), Immigrants from Guyana (14.5%, a difference of 0.64%), and Haitian (14.5%, a difference of 0.67%).
| Demographics | Rating | Rank | Seniors Poverty Over the Age of 65 |
| Immigrants | Latin America | 0.0 /100 | #306 | Tragic 14.2% |
| Immigrants | West Indies | 0.0 /100 | #307 | Tragic 14.2% |
| Trinidadians and Tobagonians | 0.0 /100 | #308 | Tragic 14.2% |
| Hondurans | 0.0 /100 | #309 | Tragic 14.2% |
| Bahamians | 0.0 /100 | #310 | Tragic 14.2% |
| Natives/Alaskans | 0.0 /100 | #311 | Tragic 14.2% |
| Hispanics or Latinos | 0.0 /100 | #312 | Tragic 14.3% |
| Barbadians | 0.0 /100 | #313 | Tragic 14.4% |
| Guyanese | 0.0 /100 | #314 | Tragic 14.4% |
| Immigrants | Ecuador | 0.0 /100 | #315 | Tragic 14.4% |
| Immigrants | Guyana | 0.0 /100 | #316 | Tragic 14.5% |
| Haitians | 0.0 /100 | #317 | Tragic 14.5% |
| Immigrants | Honduras | 0.0 /100 | #318 | Tragic 14.5% |
| Cape Verdeans | 0.0 /100 | #319 | Tragic 14.7% |
| Immigrants | Haiti | 0.0 /100 | #320 | Tragic 14.7% |
Demographics Similar to Cambodians by Seniors Poverty Over the Age of 65
In terms of seniors poverty over the age of 65, the demographic groups most similar to Cambodians are Immigrants from Hungary (10.4%, a difference of 0.0%), Immigrants from Philippines (10.4%, a difference of 0.070%), Ottawa (10.4%, a difference of 0.13%), Immigrants from Iran (10.4%, a difference of 0.15%), and Immigrants from Oceania (10.4%, a difference of 0.15%).
| Demographics | Rating | Rank | Seniors Poverty Over the Age of 65 |
| Immigrants | Bosnia and Herzegovina | 90.8 /100 | #120 | Exceptional 10.4% |
| Immigrants | Iraq | 90.7 /100 | #121 | Exceptional 10.4% |
| Immigrants | Moldova | 90.7 /100 | #122 | Exceptional 10.4% |
| Hmong | 90.0 /100 | #123 | Exceptional 10.4% |
| Asians | 89.9 /100 | #124 | Excellent 10.4% |
| Immigrants | Philippines | 89.4 /100 | #125 | Excellent 10.4% |
| Immigrants | Hungary | 89.1 /100 | #126 | Excellent 10.4% |
| Cambodians | 89.1 /100 | #127 | Excellent 10.4% |
| Ottawa | 88.5 /100 | #128 | Excellent 10.4% |
| Immigrants | Iran | 88.4 /100 | #129 | Excellent 10.4% |
| Immigrants | Oceania | 88.4 /100 | #130 | Excellent 10.4% |
| Egyptians | 87.8 /100 | #131 | Excellent 10.5% |
| Immigrants | Turkey | 87.7 /100 | #132 | Excellent 10.5% |
| Guamanians/Chamorros | 87.5 /100 | #133 | Excellent 10.5% |
| Sierra Leoneans | 86.8 /100 | #134 | Excellent 10.5% |