Bhutanese vs Czechoslovakian Seniors Poverty Over the Age of 65
COMPARE
Bhutanese
Czechoslovakian
Seniors Poverty Over the Age of 65
Seniors Poverty Over the Age of 65 Comparison
Bhutanese
Czechoslovakians
9.3%
SENIORS POVERTY OVER THE AGE OF 65
99.9/ 100
METRIC RATING
29th/ 347
METRIC RANK
9.5%
SENIORS POVERTY OVER THE AGE OF 65
99.8/ 100
METRIC RATING
36th/ 347
METRIC RANK
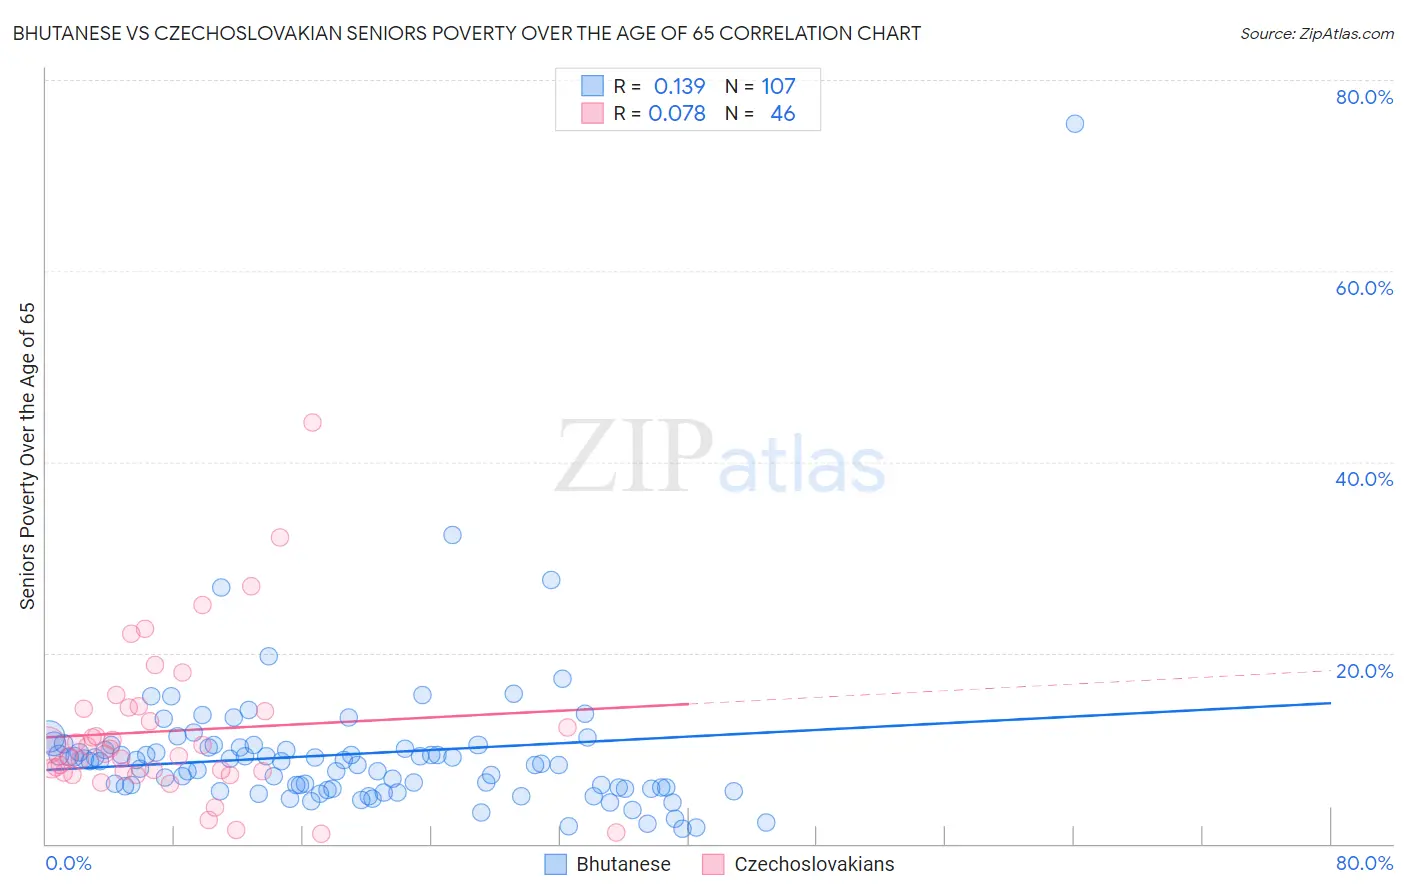
Bhutanese vs Czechoslovakian Seniors Poverty Over the Age of 65 Correlation Chart
The statistical analysis conducted on geographies consisting of 453,130,109 people shows a poor positive correlation between the proportion of Bhutanese and poverty level among seniors over the age of 65 in the United States with a correlation coefficient (R) of 0.139 and weighted average of 9.3%. Similarly, the statistical analysis conducted on geographies consisting of 367,521,017 people shows a slight positive correlation between the proportion of Czechoslovakians and poverty level among seniors over the age of 65 in the United States with a correlation coefficient (R) of 0.078 and weighted average of 9.5%, a difference of 1.2%.
Seniors Poverty Over the Age of 65 Correlation Summary
| Measurement | Bhutanese | Czechoslovakian |
| Minimum | 1.5% | 1.1% |
| Maximum | 75.4% | 44.2% |
| Range | 73.9% | 43.1% |
| Mean | 9.4% | 11.8% |
| Median | 8.6% | 9.7% |
| Interquartile 25% (IQ1) | 5.8% | 7.6% |
| Interquartile 75% (IQ3) | 10.1% | 14.2% |
| Interquartile Range (IQR) | 4.3% | 6.6% |
| Standard Deviation (Sample) | 8.1% | 8.2% |
| Standard Deviation (Population) | 8.0% | 8.1% |
Demographics Similar to Bhutanese and Czechoslovakians by Seniors Poverty Over the Age of 65
In terms of seniors poverty over the age of 65, the demographic groups most similar to Bhutanese are Menominee (9.4%, a difference of 0.15%), Tongan (9.3%, a difference of 0.32%), Finnish (9.4%, a difference of 0.37%), Italian (9.3%, a difference of 0.52%), and Immigrants from Scotland (9.3%, a difference of 0.60%). Similarly, the demographic groups most similar to Czechoslovakians are Latvian (9.5%, a difference of 0.050%), British (9.4%, a difference of 0.43%), Scotch-Irish (9.5%, a difference of 0.50%), Belgian (9.5%, a difference of 0.52%), and Native Hawaiian (9.4%, a difference of 0.53%).
| Demographics | Rating | Rank | Seniors Poverty Over the Age of 65 |
| Slovenes | 99.9 /100 | #22 | Exceptional 9.3% |
| Welsh | 99.9 /100 | #23 | Exceptional 9.3% |
| Bulgarians | 99.9 /100 | #24 | Exceptional 9.3% |
| Irish | 99.9 /100 | #25 | Exceptional 9.3% |
| Immigrants | Scotland | 99.9 /100 | #26 | Exceptional 9.3% |
| Italians | 99.9 /100 | #27 | Exceptional 9.3% |
| Tongans | 99.9 /100 | #28 | Exceptional 9.3% |
| Bhutanese | 99.9 /100 | #29 | Exceptional 9.3% |
| Menominee | 99.8 /100 | #30 | Exceptional 9.4% |
| Finns | 99.8 /100 | #31 | Exceptional 9.4% |
| Northern Europeans | 99.8 /100 | #32 | Exceptional 9.4% |
| Native Hawaiians | 99.8 /100 | #33 | Exceptional 9.4% |
| British | 99.8 /100 | #34 | Exceptional 9.4% |
| Latvians | 99.8 /100 | #35 | Exceptional 9.5% |
| Czechoslovakians | 99.8 /100 | #36 | Exceptional 9.5% |
| Scotch-Irish | 99.7 /100 | #37 | Exceptional 9.5% |
| Belgians | 99.7 /100 | #38 | Exceptional 9.5% |
| Greeks | 99.6 /100 | #39 | Exceptional 9.6% |
| Assyrians/Chaldeans/Syriacs | 99.6 /100 | #40 | Exceptional 9.6% |
| Immigrants | North Macedonia | 99.6 /100 | #41 | Exceptional 9.6% |
| Zimbabweans | 99.6 /100 | #42 | Exceptional 9.6% |