Bangladeshi vs Immigrants from Kazakhstan Single Male Poverty
COMPARE
Bangladeshi
Immigrants from Kazakhstan
Single Male Poverty
Single Male Poverty Comparison
Bangladeshis
Immigrants from Kazakhstan
13.3%
SINGLE MALE POVERTY
3.7/ 100
METRIC RATING
235th/ 347
METRIC RANK
12.2%
SINGLE MALE POVERTY
96.7/ 100
METRIC RATING
104th/ 347
METRIC RANK
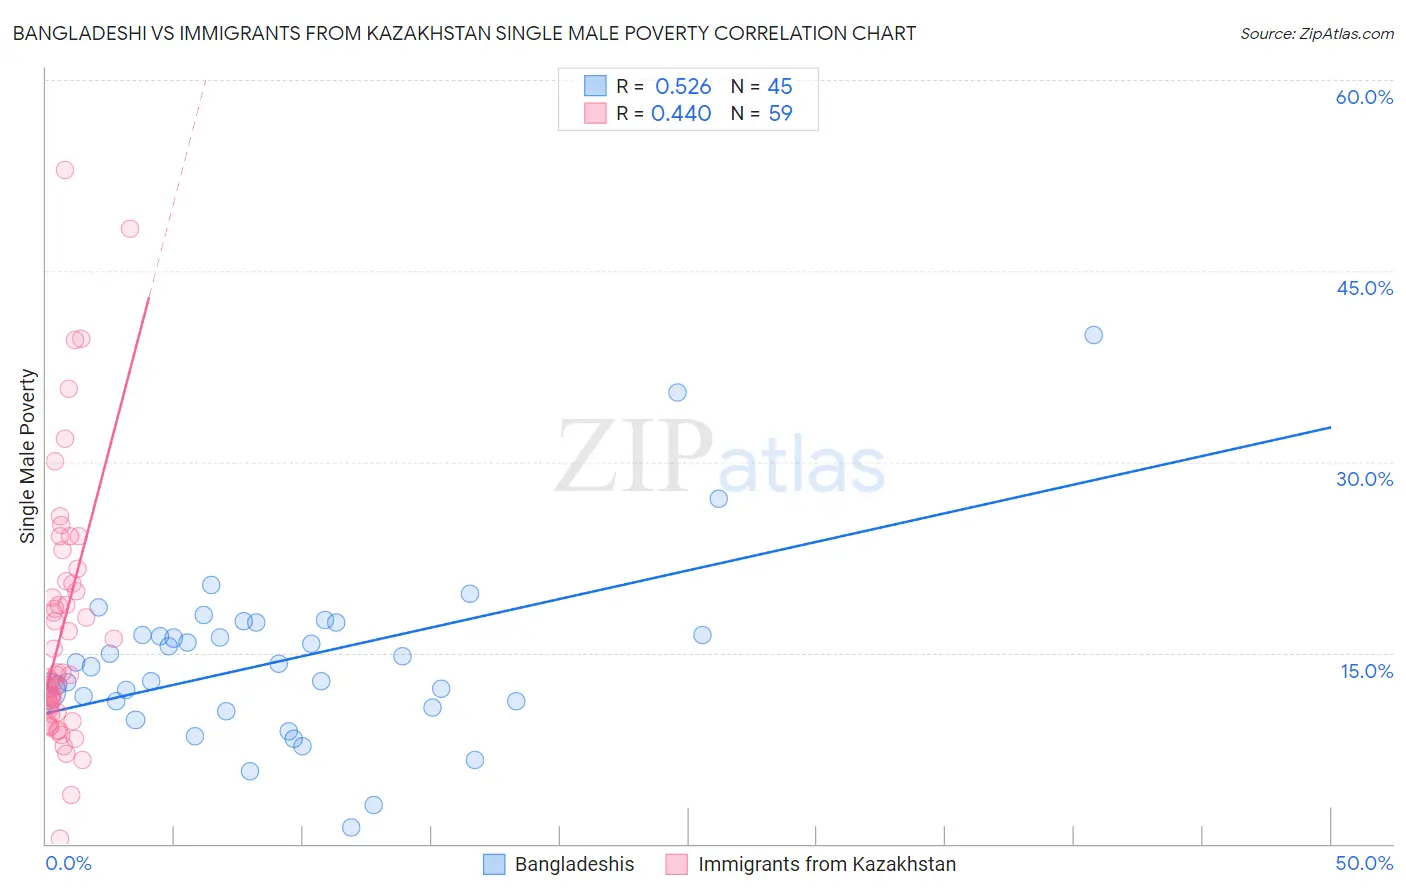
Bangladeshi vs Immigrants from Kazakhstan Single Male Poverty Correlation Chart
The statistical analysis conducted on geographies consisting of 134,113,248 people shows a substantial positive correlation between the proportion of Bangladeshis and poverty level among single males in the United States with a correlation coefficient (R) of 0.526 and weighted average of 13.3%. Similarly, the statistical analysis conducted on geographies consisting of 117,184,903 people shows a moderate positive correlation between the proportion of Immigrants from Kazakhstan and poverty level among single males in the United States with a correlation coefficient (R) of 0.440 and weighted average of 12.2%, a difference of 9.1%.
Single Male Poverty Correlation Summary
| Measurement | Bangladeshi | Immigrants from Kazakhstan |
| Minimum | 1.3% | 0.41% |
| Maximum | 40.0% | 52.9% |
| Range | 38.7% | 52.5% |
| Mean | 14.5% | 17.1% |
| Median | 14.1% | 13.3% |
| Interquartile 25% (IQ1) | 10.9% | 10.3% |
| Interquartile 75% (IQ3) | 16.9% | 20.6% |
| Interquartile Range (IQR) | 5.9% | 10.2% |
| Standard Deviation (Sample) | 6.9% | 10.3% |
| Standard Deviation (Population) | 6.8% | 10.2% |
Similar Demographics by Single Male Poverty
Demographics Similar to Bangladeshis by Single Male Poverty
In terms of single male poverty, the demographic groups most similar to Bangladeshis are Luxembourger (13.4%, a difference of 0.050%), British (13.3%, a difference of 0.10%), Canadian (13.3%, a difference of 0.10%), British West Indian (13.4%, a difference of 0.11%), and Immigrants from Ghana (13.4%, a difference of 0.21%).
| Demographics | Rating | Rank | Single Male Poverty |
| Lebanese | 6.6 /100 | #228 | Tragic 13.2% |
| Europeans | 6.2 /100 | #229 | Tragic 13.3% |
| Ghanaians | 6.1 /100 | #230 | Tragic 13.3% |
| Slavs | 5.3 /100 | #231 | Tragic 13.3% |
| Immigrants | Caribbean | 5.0 /100 | #232 | Tragic 13.3% |
| British | 4.0 /100 | #233 | Tragic 13.3% |
| Canadians | 4.0 /100 | #234 | Tragic 13.3% |
| Bangladeshis | 3.7 /100 | #235 | Tragic 13.3% |
| Luxembourgers | 3.6 /100 | #236 | Tragic 13.4% |
| British West Indians | 3.4 /100 | #237 | Tragic 13.4% |
| Immigrants | Ghana | 3.2 /100 | #238 | Tragic 13.4% |
| Czechoslovakians | 3.0 /100 | #239 | Tragic 13.4% |
| Belizeans | 2.3 /100 | #240 | Tragic 13.4% |
| Immigrants | Germany | 2.1 /100 | #241 | Tragic 13.4% |
| Carpatho Rusyns | 2.1 /100 | #242 | Tragic 13.4% |
Demographics Similar to Immigrants from Kazakhstan by Single Male Poverty
In terms of single male poverty, the demographic groups most similar to Immigrants from Kazakhstan are Immigrants from Armenia (12.2%, a difference of 0.010%), Immigrants from Europe (12.2%, a difference of 0.14%), Immigrants from Latvia (12.2%, a difference of 0.15%), Immigrants from Australia (12.2%, a difference of 0.19%), and Immigrants from Cuba (12.2%, a difference of 0.30%).
| Demographics | Rating | Rank | Single Male Poverty |
| Immigrants | Italy | 97.4 /100 | #97 | Exceptional 12.2% |
| Guamanians/Chamorros | 97.4 /100 | #98 | Exceptional 12.2% |
| Immigrants | Cuba | 97.3 /100 | #99 | Exceptional 12.2% |
| Immigrants | Australia | 97.1 /100 | #100 | Exceptional 12.2% |
| Immigrants | Latvia | 97.0 /100 | #101 | Exceptional 12.2% |
| Immigrants | Europe | 97.0 /100 | #102 | Exceptional 12.2% |
| Immigrants | Armenia | 96.7 /100 | #103 | Exceptional 12.2% |
| Immigrants | Kazakhstan | 96.7 /100 | #104 | Exceptional 12.2% |
| Jordanians | 95.9 /100 | #105 | Exceptional 12.3% |
| Immigrants | Morocco | 95.6 /100 | #106 | Exceptional 12.3% |
| Iraqis | 95.1 /100 | #107 | Exceptional 12.3% |
| Immigrants | Eastern Africa | 95.0 /100 | #108 | Exceptional 12.3% |
| Ugandans | 94.5 /100 | #109 | Exceptional 12.3% |
| Immigrants | Portugal | 93.6 /100 | #110 | Exceptional 12.3% |
| Immigrants | North Macedonia | 93.6 /100 | #111 | Exceptional 12.3% |