Bangladeshi vs Immigrants from England Single Male Poverty
COMPARE
Bangladeshi
Immigrants from England
Single Male Poverty
Single Male Poverty Comparison
Bangladeshis
Immigrants from England
13.3%
SINGLE MALE POVERTY
3.7/ 100
METRIC RATING
235th/ 347
METRIC RANK
13.0%
SINGLE MALE POVERTY
23.4/ 100
METRIC RATING
195th/ 347
METRIC RANK
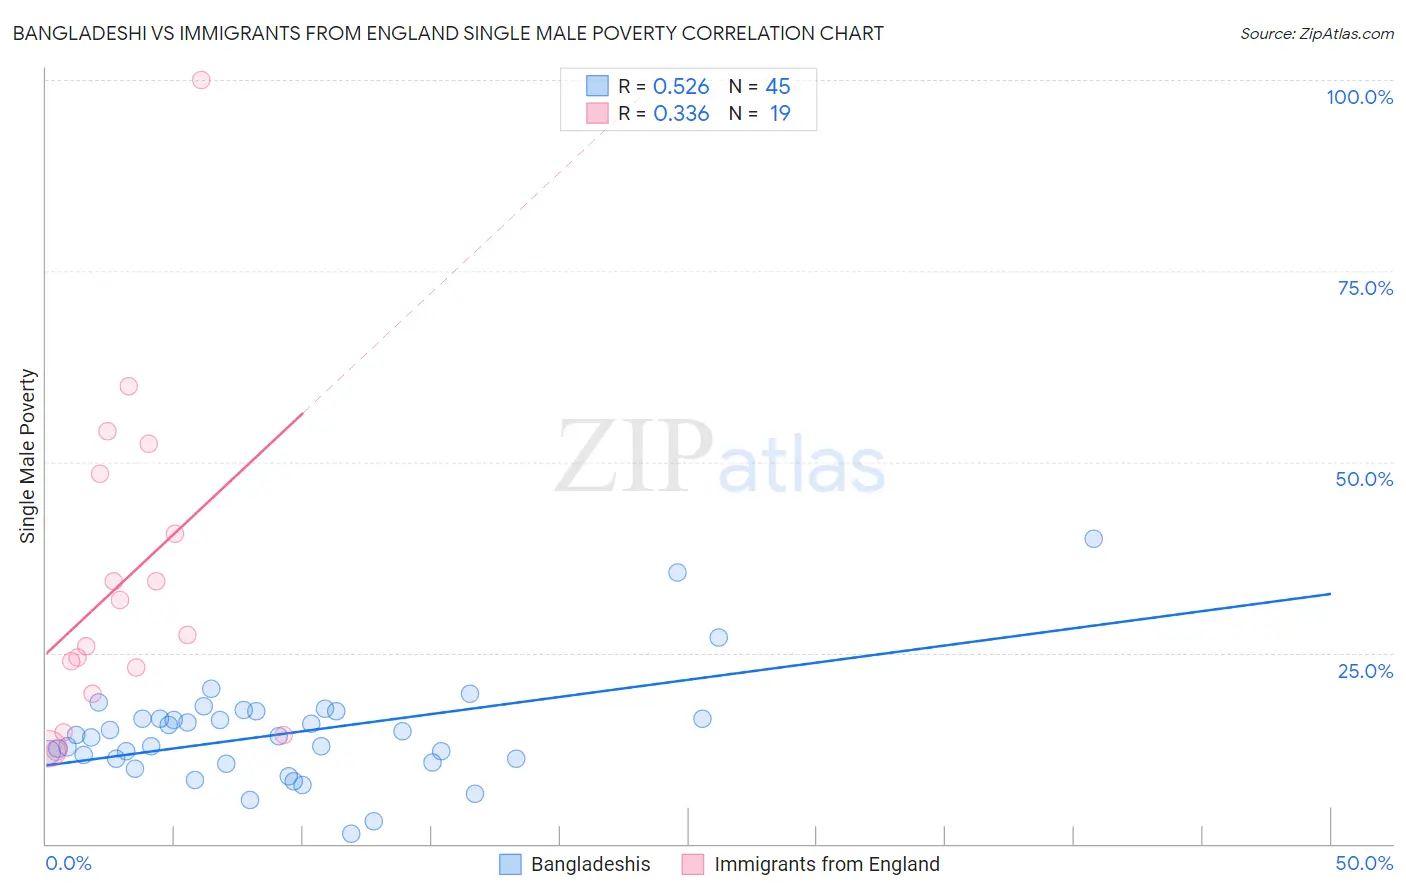
Bangladeshi vs Immigrants from England Single Male Poverty Correlation Chart
The statistical analysis conducted on geographies consisting of 134,113,248 people shows a substantial positive correlation between the proportion of Bangladeshis and poverty level among single males in the United States with a correlation coefficient (R) of 0.526 and weighted average of 13.3%. Similarly, the statistical analysis conducted on geographies consisting of 343,807,729 people shows a mild positive correlation between the proportion of Immigrants from England and poverty level among single males in the United States with a correlation coefficient (R) of 0.336 and weighted average of 13.0%, a difference of 2.7%.
Single Male Poverty Correlation Summary
| Measurement | Bangladeshi | Immigrants from England |
| Minimum | 1.3% | 12.2% |
| Maximum | 40.0% | 100.0% |
| Range | 38.7% | 87.8% |
| Mean | 14.5% | 34.4% |
| Median | 14.1% | 27.3% |
| Interquartile 25% (IQ1) | 10.9% | 19.7% |
| Interquartile 75% (IQ3) | 16.9% | 48.4% |
| Interquartile Range (IQR) | 5.9% | 28.8% |
| Standard Deviation (Sample) | 6.9% | 21.5% |
| Standard Deviation (Population) | 6.8% | 21.0% |
Similar Demographics by Single Male Poverty
Demographics Similar to Bangladeshis by Single Male Poverty
In terms of single male poverty, the demographic groups most similar to Bangladeshis are Luxembourger (13.4%, a difference of 0.050%), British (13.3%, a difference of 0.10%), Canadian (13.3%, a difference of 0.10%), British West Indian (13.4%, a difference of 0.11%), and Immigrants from Ghana (13.4%, a difference of 0.21%).
| Demographics | Rating | Rank | Single Male Poverty |
| Lebanese | 6.6 /100 | #228 | Tragic 13.2% |
| Europeans | 6.2 /100 | #229 | Tragic 13.3% |
| Ghanaians | 6.1 /100 | #230 | Tragic 13.3% |
| Slavs | 5.3 /100 | #231 | Tragic 13.3% |
| Immigrants | Caribbean | 5.0 /100 | #232 | Tragic 13.3% |
| British | 4.0 /100 | #233 | Tragic 13.3% |
| Canadians | 4.0 /100 | #234 | Tragic 13.3% |
| Bangladeshis | 3.7 /100 | #235 | Tragic 13.3% |
| Luxembourgers | 3.6 /100 | #236 | Tragic 13.4% |
| British West Indians | 3.4 /100 | #237 | Tragic 13.4% |
| Immigrants | Ghana | 3.2 /100 | #238 | Tragic 13.4% |
| Czechoslovakians | 3.0 /100 | #239 | Tragic 13.4% |
| Belizeans | 2.3 /100 | #240 | Tragic 13.4% |
| Immigrants | Germany | 2.1 /100 | #241 | Tragic 13.4% |
| Carpatho Rusyns | 2.1 /100 | #242 | Tragic 13.4% |
Demographics Similar to Immigrants from England by Single Male Poverty
In terms of single male poverty, the demographic groups most similar to Immigrants from England are Immigrants from Grenada (13.0%, a difference of 0.020%), Immigrants from Laos (13.0%, a difference of 0.020%), Lithuanian (13.0%, a difference of 0.090%), Immigrants from Norway (13.0%, a difference of 0.12%), and Liberian (13.0%, a difference of 0.13%).
| Demographics | Rating | Rank | Single Male Poverty |
| Macedonians | 31.5 /100 | #188 | Fair 12.9% |
| Portuguese | 30.2 /100 | #189 | Fair 12.9% |
| Arabs | 27.0 /100 | #190 | Fair 13.0% |
| Immigrants | Thailand | 26.6 /100 | #191 | Fair 13.0% |
| Immigrants | Jamaica | 26.5 /100 | #192 | Fair 13.0% |
| Immigrants | South Africa | 26.1 /100 | #193 | Fair 13.0% |
| Liberians | 25.2 /100 | #194 | Fair 13.0% |
| Immigrants | England | 23.4 /100 | #195 | Fair 13.0% |
| Immigrants | Grenada | 23.1 /100 | #196 | Fair 13.0% |
| Immigrants | Laos | 23.1 /100 | #197 | Fair 13.0% |
| Lithuanians | 22.1 /100 | #198 | Fair 13.0% |
| Immigrants | Norway | 21.8 /100 | #199 | Fair 13.0% |
| Slovenes | 21.6 /100 | #200 | Fair 13.0% |
| Trinidadians and Tobagonians | 21.4 /100 | #201 | Fair 13.0% |
| Basques | 20.7 /100 | #202 | Fair 13.0% |