Bangladeshi vs Spanish American Unemployment Among Seniors over 65 years
COMPARE
Bangladeshi
Spanish American
Unemployment Among Seniors over 65 years
Unemployment Among Seniors over 65 years Comparison
Bangladeshis
Spanish Americans
5.2%
UNEMPLOYMENT AMONG SENIORS OVER 65 YEARS
32.3/ 100
METRIC RATING
189th/ 347
METRIC RANK
5.1%
UNEMPLOYMENT AMONG SENIORS OVER 65 YEARS
50.0/ 100
METRIC RATING
174th/ 347
METRIC RANK
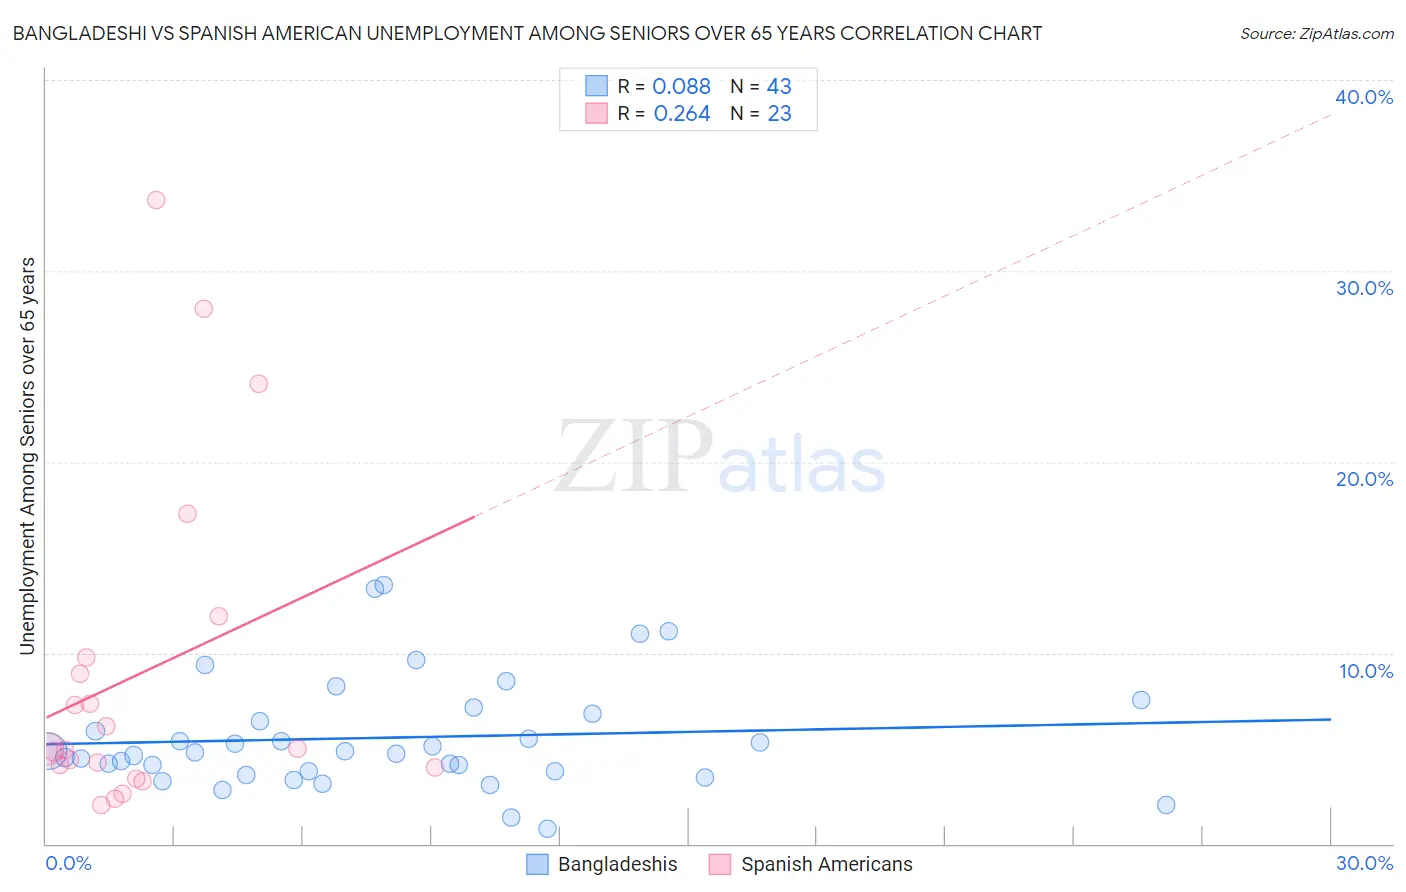
Bangladeshi vs Spanish American Unemployment Among Seniors over 65 years Correlation Chart
The statistical analysis conducted on geographies consisting of 132,453,489 people shows a slight positive correlation between the proportion of Bangladeshis and unemployment rate amomg seniors over the age of 65 in the United States with a correlation coefficient (R) of 0.088 and weighted average of 5.2%. Similarly, the statistical analysis conducted on geographies consisting of 99,414,845 people shows a weak positive correlation between the proportion of Spanish Americans and unemployment rate amomg seniors over the age of 65 in the United States with a correlation coefficient (R) of 0.264 and weighted average of 5.1%, a difference of 0.59%.
Unemployment Among Seniors over 65 years Correlation Summary
| Measurement | Bangladeshi | Spanish American |
| Minimum | 0.80% | 2.0% |
| Maximum | 13.6% | 33.7% |
| Range | 12.8% | 31.7% |
| Mean | 5.6% | 8.9% |
| Median | 4.8% | 5.0% |
| Interquartile 25% (IQ1) | 3.8% | 4.0% |
| Interquartile 75% (IQ3) | 6.8% | 9.8% |
| Interquartile Range (IQR) | 3.0% | 5.8% |
| Standard Deviation (Sample) | 2.9% | 8.6% |
| Standard Deviation (Population) | 2.9% | 8.5% |
Demographics Similar to Bangladeshis and Spanish Americans by Unemployment Among Seniors over 65 years
In terms of unemployment among seniors over 65 years, the demographic groups most similar to Bangladeshis are Korean (5.2%, a difference of 0.030%), Immigrants from Egypt (5.2%, a difference of 0.040%), Somali (5.2%, a difference of 0.050%), Immigrants from Denmark (5.2%, a difference of 0.050%), and American (5.2%, a difference of 0.10%). Similarly, the demographic groups most similar to Spanish Americans are Immigrants from Eastern Europe (5.1%, a difference of 0.010%), Immigrants from Spain (5.1%, a difference of 0.050%), Immigrants from Ireland (5.1%, a difference of 0.10%), Indian (Asian) (5.2%, a difference of 0.11%), and Nonimmigrants (5.1%, a difference of 0.13%).
| Demographics | Rating | Rank | Unemployment Among Seniors over 65 years |
| Immigrants | Nonimmigrants | 54.1 /100 | #171 | Average 5.1% |
| Immigrants | Ireland | 53.2 /100 | #172 | Average 5.1% |
| Immigrants | Spain | 51.7 /100 | #173 | Average 5.1% |
| Spanish Americans | 50.0 /100 | #174 | Average 5.1% |
| Immigrants | Eastern Europe | 49.8 /100 | #175 | Average 5.1% |
| Indians (Asian) | 46.6 /100 | #176 | Average 5.2% |
| Icelanders | 45.9 /100 | #177 | Average 5.2% |
| Immigrants | Belgium | 44.8 /100 | #178 | Average 5.2% |
| Immigrants | Somalia | 44.0 /100 | #179 | Average 5.2% |
| Russians | 43.6 /100 | #180 | Average 5.2% |
| Immigrants | Italy | 43.5 /100 | #181 | Average 5.2% |
| Panamanians | 43.0 /100 | #182 | Average 5.2% |
| Immigrants | Western Asia | 42.1 /100 | #183 | Average 5.2% |
| Immigrants | Serbia | 41.6 /100 | #184 | Average 5.2% |
| Immigrants | Iran | 36.0 /100 | #185 | Fair 5.2% |
| Americans | 35.1 /100 | #186 | Fair 5.2% |
| Somalis | 33.5 /100 | #187 | Fair 5.2% |
| Immigrants | Egypt | 33.2 /100 | #188 | Fair 5.2% |
| Bangladeshis | 32.3 /100 | #189 | Fair 5.2% |
| Koreans | 31.6 /100 | #190 | Fair 5.2% |
| Immigrants | Denmark | 31.0 /100 | #191 | Fair 5.2% |