Bangladeshi vs Spanish American Child Poverty Under the Age of 16
COMPARE
Bangladeshi
Spanish American
Child Poverty Under the Age of 16
Child Poverty Under the Age of 16 Comparison
Bangladeshis
Spanish Americans
19.9%
CHILD POVERTY UNDER THE AGE OF 16
0.0/ 100
METRIC RATING
278th/ 347
METRIC RANK
19.2%
CHILD POVERTY UNDER THE AGE OF 16
0.2/ 100
METRIC RATING
258th/ 347
METRIC RANK
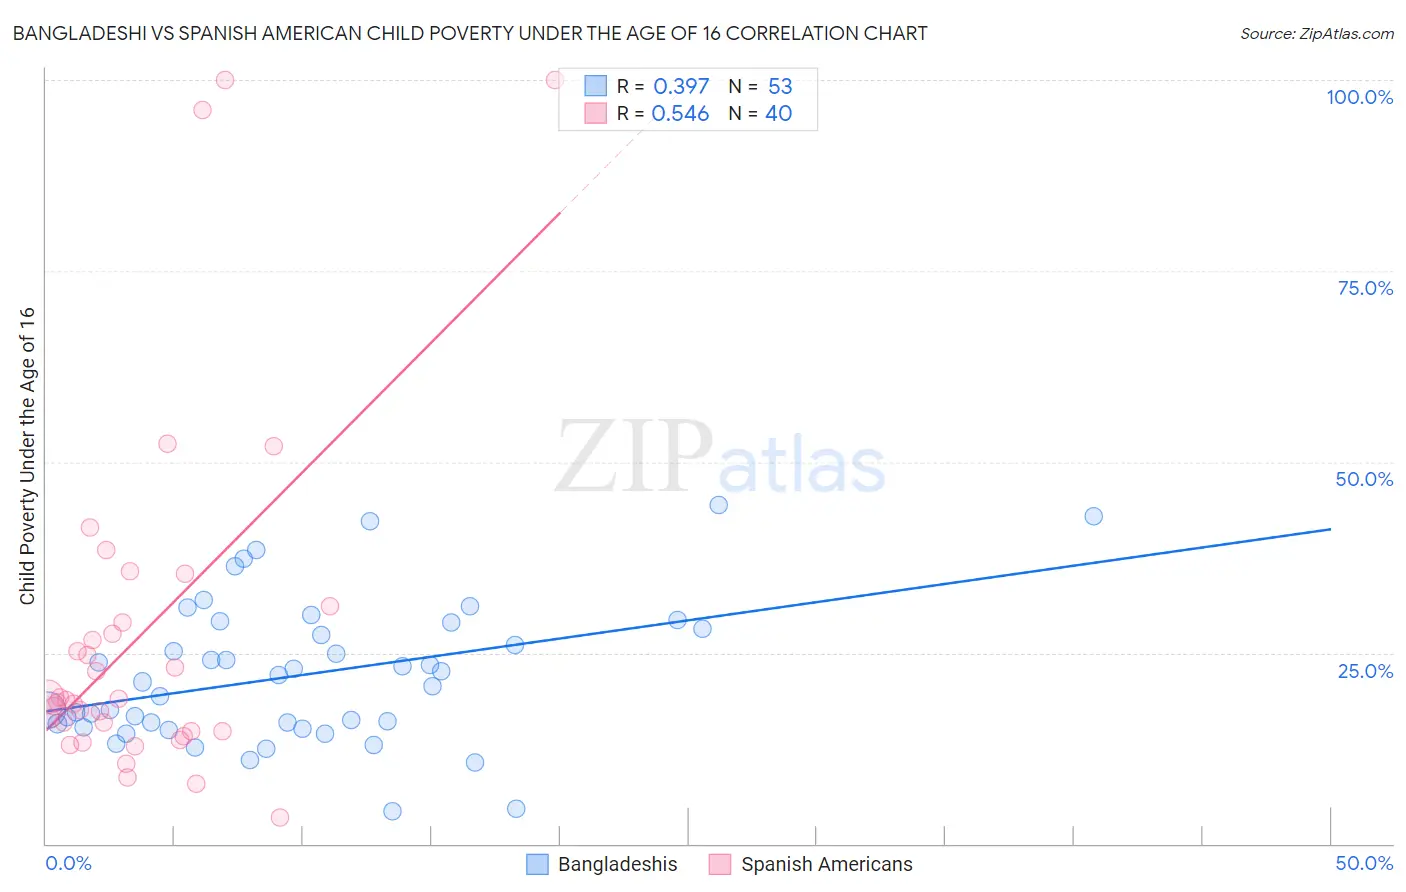
Bangladeshi vs Spanish American Child Poverty Under the Age of 16 Correlation Chart
The statistical analysis conducted on geographies consisting of 140,973,938 people shows a mild positive correlation between the proportion of Bangladeshis and poverty level among children under the age of 16 in the United States with a correlation coefficient (R) of 0.397 and weighted average of 19.9%. Similarly, the statistical analysis conducted on geographies consisting of 102,994,758 people shows a substantial positive correlation between the proportion of Spanish Americans and poverty level among children under the age of 16 in the United States with a correlation coefficient (R) of 0.546 and weighted average of 19.2%, a difference of 3.5%.
Child Poverty Under the Age of 16 Correlation Summary
| Measurement | Bangladeshi | Spanish American |
| Minimum | 4.3% | 3.4% |
| Maximum | 44.4% | 100.0% |
| Range | 40.0% | 96.6% |
| Mean | 22.1% | 27.5% |
| Median | 21.2% | 18.9% |
| Interquartile 25% (IQ1) | 15.5% | 14.7% |
| Interquartile 75% (IQ3) | 28.6% | 30.1% |
| Interquartile Range (IQR) | 13.0% | 15.4% |
| Standard Deviation (Sample) | 9.2% | 23.2% |
| Standard Deviation (Population) | 9.2% | 22.9% |
Demographics Similar to Bangladeshis and Spanish Americans by Child Poverty Under the Age of 16
In terms of child poverty under the age of 16, the demographic groups most similar to Bangladeshis are Iroquois (19.9%, a difference of 0.10%), Immigrants from Cabo Verde (19.9%, a difference of 0.24%), Immigrants from Barbados (19.9%, a difference of 0.24%), Belizean (19.9%, a difference of 0.24%), and Immigrants from Jamaica (19.8%, a difference of 0.40%). Similarly, the demographic groups most similar to Spanish Americans are Mexican American Indian (19.3%, a difference of 0.55%), Guyanese (19.3%, a difference of 0.65%), Immigrants from Burma/Myanmar (19.4%, a difference of 0.73%), Immigrants from Guyana (19.4%, a difference of 0.77%), and Vietnamese (19.4%, a difference of 1.1%).
| Demographics | Rating | Rank | Child Poverty Under the Age of 16 |
| Spanish Americans | 0.2 /100 | #258 | Tragic 19.2% |
| Mexican American Indians | 0.2 /100 | #259 | Tragic 19.3% |
| Guyanese | 0.2 /100 | #260 | Tragic 19.3% |
| Immigrants | Burma/Myanmar | 0.1 /100 | #261 | Tragic 19.4% |
| Immigrants | Guyana | 0.1 /100 | #262 | Tragic 19.4% |
| Vietnamese | 0.1 /100 | #263 | Tragic 19.4% |
| Immigrants | Ecuador | 0.1 /100 | #264 | Tragic 19.4% |
| Chickasaw | 0.1 /100 | #265 | Tragic 19.5% |
| Liberians | 0.1 /100 | #266 | Tragic 19.5% |
| Cherokee | 0.1 /100 | #267 | Tragic 19.5% |
| Jamaicans | 0.1 /100 | #268 | Tragic 19.7% |
| Immigrants | El Salvador | 0.1 /100 | #269 | Tragic 19.7% |
| Spanish American Indians | 0.1 /100 | #270 | Tragic 19.7% |
| Immigrants | Liberia | 0.1 /100 | #271 | Tragic 19.7% |
| Immigrants | Bangladesh | 0.1 /100 | #272 | Tragic 19.8% |
| Immigrants | Jamaica | 0.1 /100 | #273 | Tragic 19.8% |
| Immigrants | Cabo Verde | 0.1 /100 | #274 | Tragic 19.9% |
| Immigrants | Barbados | 0.1 /100 | #275 | Tragic 19.9% |
| Belizeans | 0.1 /100 | #276 | Tragic 19.9% |
| Iroquois | 0.1 /100 | #277 | Tragic 19.9% |
| Bangladeshis | 0.0 /100 | #278 | Tragic 19.9% |