Bangladeshi vs Taiwanese Single Male Poverty
COMPARE
Bangladeshi
Taiwanese
Single Male Poverty
Single Male Poverty Comparison
Bangladeshis
Taiwanese
13.3%
SINGLE MALE POVERTY
3.7/ 100
METRIC RATING
235th/ 347
METRIC RANK
10.9%
SINGLE MALE POVERTY
100.0/ 100
METRIC RATING
9th/ 347
METRIC RANK
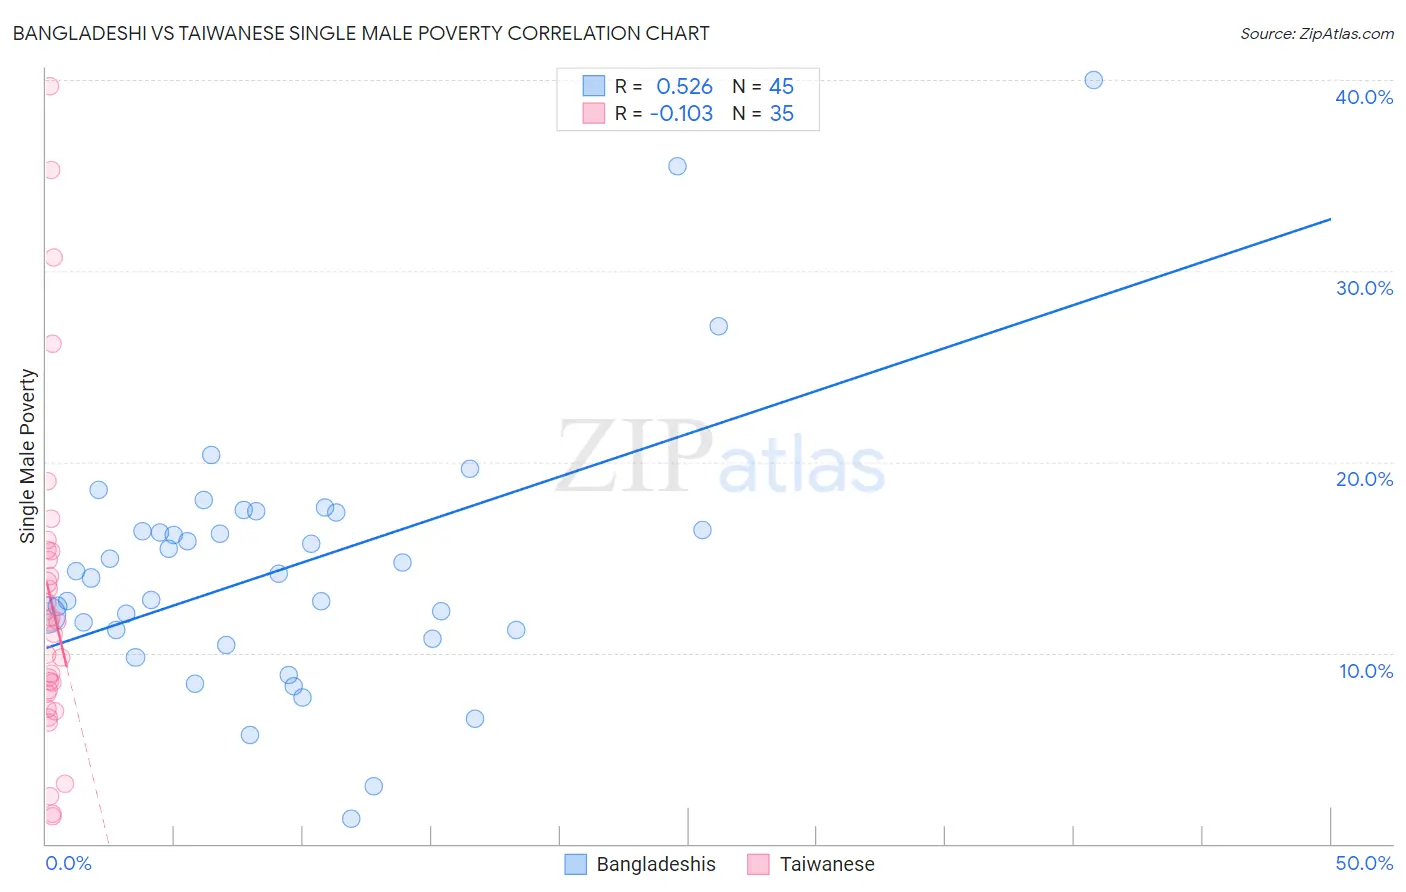
Bangladeshi vs Taiwanese Single Male Poverty Correlation Chart
The statistical analysis conducted on geographies consisting of 134,113,248 people shows a substantial positive correlation between the proportion of Bangladeshis and poverty level among single males in the United States with a correlation coefficient (R) of 0.526 and weighted average of 13.3%. Similarly, the statistical analysis conducted on geographies consisting of 31,221,871 people shows a poor negative correlation between the proportion of Taiwanese and poverty level among single males in the United States with a correlation coefficient (R) of -0.103 and weighted average of 10.9%, a difference of 22.5%.
Single Male Poverty Correlation Summary
| Measurement | Bangladeshi | Taiwanese |
| Minimum | 1.3% | 1.4% |
| Maximum | 40.0% | 39.7% |
| Range | 38.7% | 38.3% |
| Mean | 14.5% | 12.8% |
| Median | 14.1% | 11.6% |
| Interquartile 25% (IQ1) | 10.9% | 7.8% |
| Interquartile 75% (IQ3) | 16.9% | 15.3% |
| Interquartile Range (IQR) | 5.9% | 7.4% |
| Standard Deviation (Sample) | 6.9% | 8.7% |
| Standard Deviation (Population) | 6.8% | 8.5% |
Similar Demographics by Single Male Poverty
Demographics Similar to Bangladeshis by Single Male Poverty
In terms of single male poverty, the demographic groups most similar to Bangladeshis are Luxembourger (13.4%, a difference of 0.050%), British (13.3%, a difference of 0.10%), Canadian (13.3%, a difference of 0.10%), British West Indian (13.4%, a difference of 0.11%), and Immigrants from Ghana (13.4%, a difference of 0.21%).
| Demographics | Rating | Rank | Single Male Poverty |
| Lebanese | 6.6 /100 | #228 | Tragic 13.2% |
| Europeans | 6.2 /100 | #229 | Tragic 13.3% |
| Ghanaians | 6.1 /100 | #230 | Tragic 13.3% |
| Slavs | 5.3 /100 | #231 | Tragic 13.3% |
| Immigrants | Caribbean | 5.0 /100 | #232 | Tragic 13.3% |
| British | 4.0 /100 | #233 | Tragic 13.3% |
| Canadians | 4.0 /100 | #234 | Tragic 13.3% |
| Bangladeshis | 3.7 /100 | #235 | Tragic 13.3% |
| Luxembourgers | 3.6 /100 | #236 | Tragic 13.4% |
| British West Indians | 3.4 /100 | #237 | Tragic 13.4% |
| Immigrants | Ghana | 3.2 /100 | #238 | Tragic 13.4% |
| Czechoslovakians | 3.0 /100 | #239 | Tragic 13.4% |
| Belizeans | 2.3 /100 | #240 | Tragic 13.4% |
| Immigrants | Germany | 2.1 /100 | #241 | Tragic 13.4% |
| Carpatho Rusyns | 2.1 /100 | #242 | Tragic 13.4% |
Demographics Similar to Taiwanese by Single Male Poverty
In terms of single male poverty, the demographic groups most similar to Taiwanese are Immigrants from Fiji (10.9%, a difference of 0.050%), Immigrants from Philippines (10.9%, a difference of 0.070%), Immigrants from Afghanistan (10.9%, a difference of 0.15%), Immigrants from South Central Asia (10.9%, a difference of 0.27%), and Chinese (11.0%, a difference of 0.84%).
| Demographics | Rating | Rank | Single Male Poverty |
| Immigrants | Taiwan | 100.0 /100 | #2 | Exceptional 10.3% |
| Immigrants | India | 100.0 /100 | #3 | Exceptional 10.3% |
| Immigrants | Hong Kong | 100.0 /100 | #4 | Exceptional 10.4% |
| Tongans | 100.0 /100 | #5 | Exceptional 10.5% |
| Filipinos | 100.0 /100 | #6 | Exceptional 10.6% |
| Afghans | 100.0 /100 | #7 | Exceptional 10.7% |
| Thais | 100.0 /100 | #8 | Exceptional 10.8% |
| Taiwanese | 100.0 /100 | #9 | Exceptional 10.9% |
| Immigrants | Fiji | 100.0 /100 | #10 | Exceptional 10.9% |
| Immigrants | Philippines | 100.0 /100 | #11 | Exceptional 10.9% |
| Immigrants | Afghanistan | 100.0 /100 | #12 | Exceptional 10.9% |
| Immigrants | South Central Asia | 100.0 /100 | #13 | Exceptional 10.9% |
| Chinese | 100.0 /100 | #14 | Exceptional 11.0% |
| Koreans | 100.0 /100 | #15 | Exceptional 11.0% |
| Bhutanese | 100.0 /100 | #16 | Exceptional 11.1% |