Bangladeshi vs Immigrants from the Azores Married-Couple Family Poverty
COMPARE
Bangladeshi
Immigrants from the Azores
Married-Couple Family Poverty
Married-Couple Family Poverty Comparison
Bangladeshis
Immigrants from the Azores
6.0%
MARRIED-COUPLE FAMILY POVERTY
0.5/ 100
METRIC RATING
256th/ 347
METRIC RANK
5.4%
MARRIED-COUPLE FAMILY POVERTY
27.5/ 100
METRIC RATING
195th/ 347
METRIC RANK
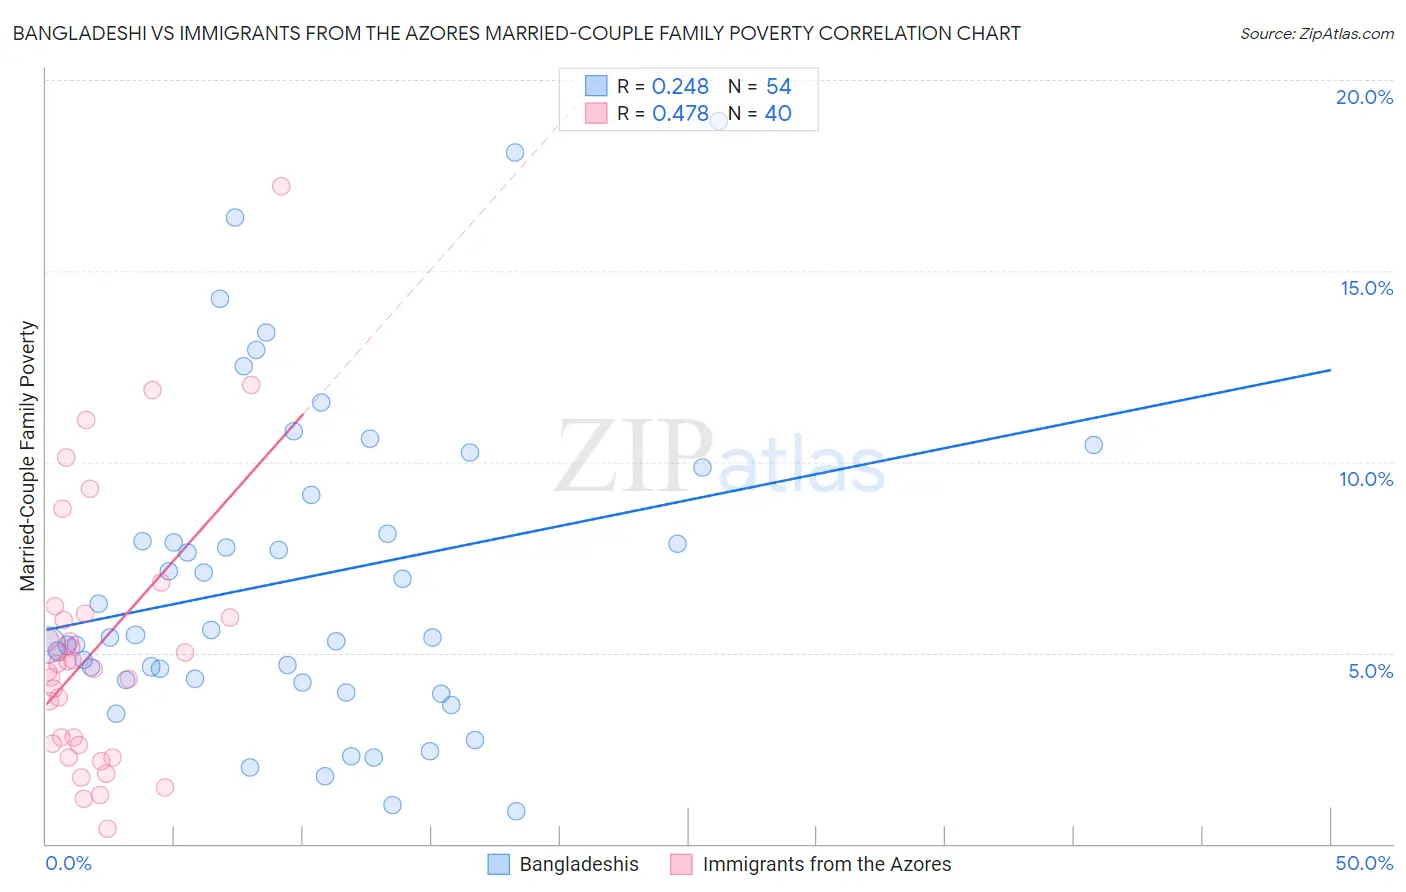
Bangladeshi vs Immigrants from the Azores Married-Couple Family Poverty Correlation Chart
The statistical analysis conducted on geographies consisting of 140,885,862 people shows a weak positive correlation between the proportion of Bangladeshis and poverty level among married-couple families in the United States with a correlation coefficient (R) of 0.248 and weighted average of 6.0%. Similarly, the statistical analysis conducted on geographies consisting of 46,091,890 people shows a moderate positive correlation between the proportion of Immigrants from the Azores and poverty level among married-couple families in the United States with a correlation coefficient (R) of 0.478 and weighted average of 5.4%, a difference of 12.0%.
Married-Couple Family Poverty Correlation Summary
| Measurement | Bangladeshi | Immigrants from the Azores |
| Minimum | 0.85% | 0.40% |
| Maximum | 18.9% | 17.2% |
| Range | 18.1% | 16.8% |
| Mean | 7.0% | 5.2% |
| Median | 5.4% | 4.6% |
| Interquartile 25% (IQ1) | 4.3% | 2.6% |
| Interquartile 75% (IQ3) | 9.1% | 6.0% |
| Interquartile Range (IQR) | 4.9% | 3.4% |
| Standard Deviation (Sample) | 4.2% | 3.5% |
| Standard Deviation (Population) | 4.2% | 3.5% |
Similar Demographics by Married-Couple Family Poverty
Demographics Similar to Bangladeshis by Married-Couple Family Poverty
In terms of married-couple family poverty, the demographic groups most similar to Bangladeshis are Immigrants from Burma/Myanmar (6.0%, a difference of 0.24%), Immigrants (6.0%, a difference of 0.37%), Comanche (6.0%, a difference of 0.50%), Immigrants from Somalia (6.0%, a difference of 0.65%), and African (6.0%, a difference of 0.71%).
| Demographics | Rating | Rank | Married-Couple Family Poverty |
| Tsimshian | 1.1 /100 | #249 | Tragic 5.9% |
| Immigrants | Eritrea | 1.1 /100 | #250 | Tragic 5.9% |
| Immigrants | Ghana | 1.0 /100 | #251 | Tragic 5.9% |
| Immigrants | Western Asia | 0.7 /100 | #252 | Tragic 6.0% |
| Africans | 0.7 /100 | #253 | Tragic 6.0% |
| Immigrants | Somalia | 0.7 /100 | #254 | Tragic 6.0% |
| Comanche | 0.7 /100 | #255 | Tragic 6.0% |
| Bangladeshis | 0.5 /100 | #256 | Tragic 6.0% |
| Immigrants | Burma/Myanmar | 0.5 /100 | #257 | Tragic 6.0% |
| Immigrants | Immigrants | 0.5 /100 | #258 | Tragic 6.0% |
| Alaskan Athabascans | 0.4 /100 | #259 | Tragic 6.1% |
| Jamaicans | 0.3 /100 | #260 | Tragic 6.1% |
| Senegalese | 0.3 /100 | #261 | Tragic 6.1% |
| Shoshone | 0.3 /100 | #262 | Tragic 6.1% |
| Immigrants | Senegal | 0.3 /100 | #263 | Tragic 6.1% |
Demographics Similar to Immigrants from the Azores by Married-Couple Family Poverty
In terms of married-couple family poverty, the demographic groups most similar to Immigrants from the Azores are Spaniard (5.4%, a difference of 0.020%), Immigrants from Israel (5.4%, a difference of 0.040%), Liberian (5.4%, a difference of 0.17%), Immigrants from Belarus (5.4%, a difference of 0.20%), and Malaysian (5.4%, a difference of 0.27%).
| Demographics | Rating | Rank | Married-Couple Family Poverty |
| Israelis | 33.1 /100 | #188 | Fair 5.3% |
| South American Indians | 32.5 /100 | #189 | Fair 5.3% |
| Ugandans | 31.6 /100 | #190 | Fair 5.3% |
| Immigrants | Cabo Verde | 30.9 /100 | #191 | Fair 5.3% |
| Cape Verdeans | 30.7 /100 | #192 | Fair 5.3% |
| Malaysians | 29.5 /100 | #193 | Fair 5.4% |
| Immigrants | Israel | 27.8 /100 | #194 | Fair 5.4% |
| Immigrants | Azores | 27.5 /100 | #195 | Fair 5.4% |
| Spaniards | 27.4 /100 | #196 | Fair 5.4% |
| Liberians | 26.3 /100 | #197 | Fair 5.4% |
| Immigrants | Belarus | 26.2 /100 | #198 | Fair 5.4% |
| Uruguayans | 25.0 /100 | #199 | Fair 5.4% |
| Immigrants | Morocco | 24.3 /100 | #200 | Fair 5.4% |
| Lebanese | 24.1 /100 | #201 | Fair 5.4% |
| Immigrants | Middle Africa | 23.8 /100 | #202 | Fair 5.4% |