Bangladeshi vs Immigrants from the Azores Unemployment Among Women with Children Ages 6 to 17 years
COMPARE
Bangladeshi
Immigrants from the Azores
Unemployment Among Women with Children Ages 6 to 17 years
Unemployment Among Women with Children Ages 6 to 17 years Comparison
Bangladeshis
Immigrants from the Azores
7.4%
UNEMPLOYMENT AMONG WOMEN WITH CHILDREN AGES 6 TO 17 YEARS
100.0/ 100
METRIC RATING
12th/ 347
METRIC RANK
9.3%
UNEMPLOYMENT AMONG WOMEN WITH CHILDREN AGES 6 TO 17 YEARS
4.6/ 100
METRIC RATING
226th/ 347
METRIC RANK
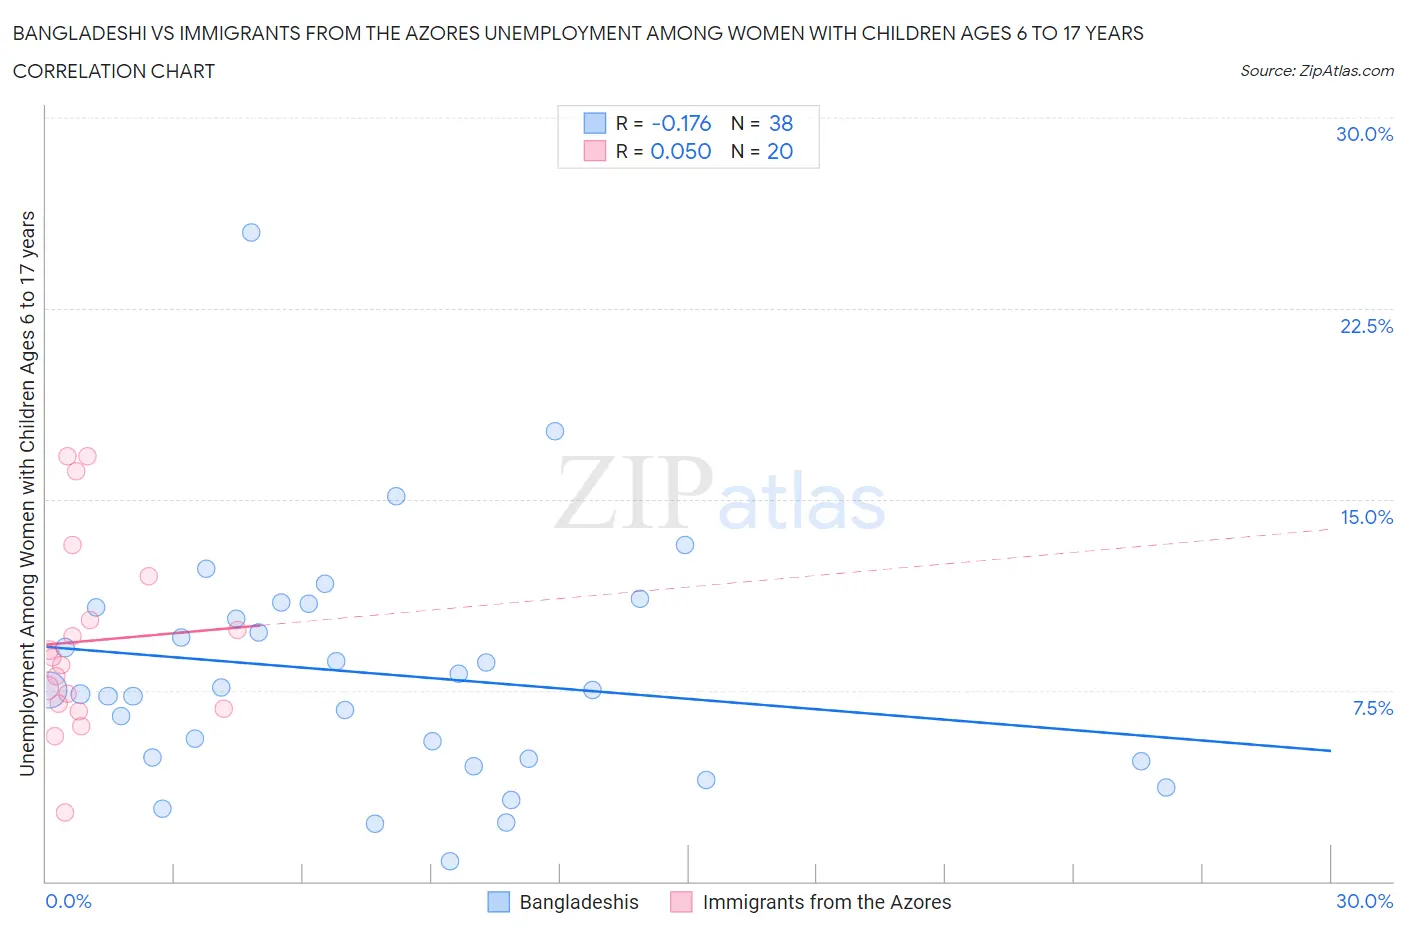
Bangladeshi vs Immigrants from the Azores Unemployment Among Women with Children Ages 6 to 17 years Correlation Chart
The statistical analysis conducted on geographies consisting of 118,644,853 people shows a poor negative correlation between the proportion of Bangladeshis and unemployment rate among women with children between the ages 6 and 17 in the United States with a correlation coefficient (R) of -0.176 and weighted average of 7.4%. Similarly, the statistical analysis conducted on geographies consisting of 39,080,392 people shows no correlation between the proportion of Immigrants from the Azores and unemployment rate among women with children between the ages 6 and 17 in the United States with a correlation coefficient (R) of 0.050 and weighted average of 9.3%, a difference of 26.0%.
Unemployment Among Women with Children Ages 6 to 17 years Correlation Summary
| Measurement | Bangladeshi | Immigrants from the Azores |
| Minimum | 0.80% | 2.7% |
| Maximum | 25.5% | 16.7% |
| Range | 24.7% | 14.0% |
| Mean | 8.2% | 9.4% |
| Median | 7.5% | 8.6% |
| Interquartile 25% (IQ1) | 4.8% | 6.9% |
| Interquartile 75% (IQ3) | 10.8% | 11.1% |
| Interquartile Range (IQR) | 6.0% | 4.2% |
| Standard Deviation (Sample) | 4.7% | 3.8% |
| Standard Deviation (Population) | 4.6% | 3.7% |
Similar Demographics by Unemployment Among Women with Children Ages 6 to 17 years
Demographics Similar to Bangladeshis by Unemployment Among Women with Children Ages 6 to 17 years
In terms of unemployment among women with children ages 6 to 17 years, the demographic groups most similar to Bangladeshis are Immigrants from Taiwan (7.3%, a difference of 0.33%), Indonesian (7.4%, a difference of 0.71%), Sudanese (7.4%, a difference of 0.75%), Immigrants from Fiji (7.3%, a difference of 1.0%), and Puget Sound Salish (7.5%, a difference of 1.8%).
| Demographics | Rating | Rank | Unemployment Among Women with Children Ages 6 to 17 years |
| Okinawans | 100.0 /100 | #5 | Exceptional 7.0% |
| Tlingit-Haida | 100.0 /100 | #6 | Exceptional 7.1% |
| Soviet Union | 100.0 /100 | #7 | Exceptional 7.1% |
| Immigrants | Hong Kong | 100.0 /100 | #8 | Exceptional 7.2% |
| Assyrians/Chaldeans/Syriacs | 100.0 /100 | #9 | Exceptional 7.2% |
| Immigrants | Fiji | 100.0 /100 | #10 | Exceptional 7.3% |
| Immigrants | Taiwan | 100.0 /100 | #11 | Exceptional 7.3% |
| Bangladeshis | 100.0 /100 | #12 | Exceptional 7.4% |
| Indonesians | 100.0 /100 | #13 | Exceptional 7.4% |
| Sudanese | 100.0 /100 | #14 | Exceptional 7.4% |
| Puget Sound Salish | 100.0 /100 | #15 | Exceptional 7.5% |
| Immigrants | Burma/Myanmar | 100.0 /100 | #16 | Exceptional 7.5% |
| Cambodians | 100.0 /100 | #17 | Exceptional 7.5% |
| Afghans | 100.0 /100 | #18 | Exceptional 7.6% |
| Filipinos | 100.0 /100 | #19 | Exceptional 7.6% |
Demographics Similar to Immigrants from the Azores by Unemployment Among Women with Children Ages 6 to 17 years
In terms of unemployment among women with children ages 6 to 17 years, the demographic groups most similar to Immigrants from the Azores are Panamanian (9.3%, a difference of 0.020%), Estonian (9.3%, a difference of 0.050%), Lumbee (9.3%, a difference of 0.080%), Chinese (9.3%, a difference of 0.14%), and Immigrants from El Salvador (9.3%, a difference of 0.15%).
| Demographics | Rating | Rank | Unemployment Among Women with Children Ages 6 to 17 years |
| Immigrants | Scotland | 6.6 /100 | #219 | Tragic 9.2% |
| Belgians | 6.4 /100 | #220 | Tragic 9.2% |
| Crow | 5.8 /100 | #221 | Tragic 9.2% |
| Immigrants | Southern Europe | 5.8 /100 | #222 | Tragic 9.2% |
| Immigrants | Eritrea | 5.8 /100 | #223 | Tragic 9.2% |
| Immigrants | El Salvador | 5.3 /100 | #224 | Tragic 9.3% |
| Chinese | 5.2 /100 | #225 | Tragic 9.3% |
| Immigrants | Azores | 4.6 /100 | #226 | Tragic 9.3% |
| Panamanians | 4.5 /100 | #227 | Tragic 9.3% |
| Estonians | 4.4 /100 | #228 | Tragic 9.3% |
| Lumbee | 4.3 /100 | #229 | Tragic 9.3% |
| Welsh | 4.0 /100 | #230 | Tragic 9.3% |
| Macedonians | 3.9 /100 | #231 | Tragic 9.3% |
| French American Indians | 3.7 /100 | #232 | Tragic 9.3% |
| Immigrants | St. Vincent and the Grenadines | 3.3 /100 | #233 | Tragic 9.3% |