Bangladeshi vs Immigrants from the Azores Disability Age Under 5
COMPARE
Bangladeshi
Immigrants from the Azores
Disability Age Under 5
Disability Age Under 5 Comparison
Bangladeshis
Immigrants from the Azores
1.3%
DISABILITY AGE UNDER 5
15.5/ 100
METRIC RATING
216th/ 347
METRIC RANK
2.2%
DISABILITY AGE UNDER 5
0.0/ 100
METRIC RATING
339th/ 347
METRIC RANK
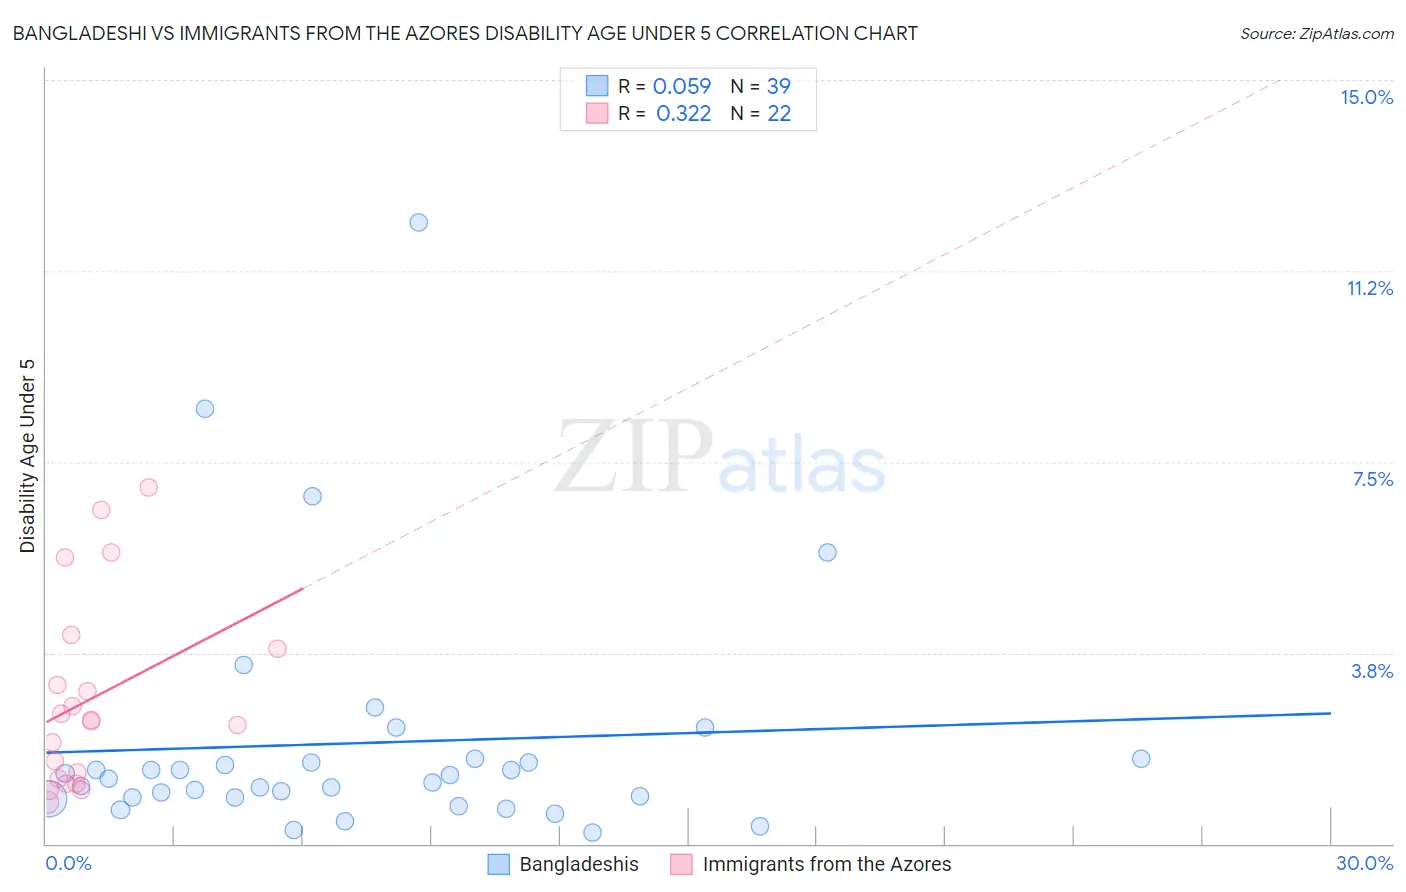
Bangladeshi vs Immigrants from the Azores Disability Age Under 5 Correlation Chart
The statistical analysis conducted on geographies consisting of 104,059,534 people shows a slight positive correlation between the proportion of Bangladeshis and percentage of population with a disability under the age of 5 in the United States with a correlation coefficient (R) of 0.059 and weighted average of 1.3%. Similarly, the statistical analysis conducted on geographies consisting of 32,548,094 people shows a mild positive correlation between the proportion of Immigrants from the Azores and percentage of population with a disability under the age of 5 in the United States with a correlation coefficient (R) of 0.322 and weighted average of 2.2%, a difference of 73.6%.
Disability Age Under 5 Correlation Summary
| Measurement | Bangladeshi | Immigrants from the Azores |
| Minimum | 0.22% | 0.81% |
| Maximum | 12.2% | 7.0% |
| Range | 12.0% | 6.2% |
| Mean | 2.0% | 2.9% |
| Median | 1.3% | 2.4% |
| Interquartile 25% (IQ1) | 0.92% | 1.3% |
| Interquartile 75% (IQ3) | 1.7% | 3.8% |
| Interquartile Range (IQR) | 0.74% | 2.6% |
| Standard Deviation (Sample) | 2.4% | 1.9% |
| Standard Deviation (Population) | 2.4% | 1.8% |
Similar Demographics by Disability Age Under 5
Demographics Similar to Bangladeshis by Disability Age Under 5
In terms of disability age under 5, the demographic groups most similar to Bangladeshis are Syrian (1.3%, a difference of 0.10%), Cypriot (1.3%, a difference of 0.10%), Immigrants from Chile (1.3%, a difference of 0.27%), Malaysian (1.3%, a difference of 0.41%), and Immigrants from Sudan (1.3%, a difference of 0.50%).
| Demographics | Rating | Rank | Disability Age Under 5 |
| Bulgarians | 19.5 /100 | #209 | Poor 1.3% |
| Pakistanis | 19.4 /100 | #210 | Poor 1.3% |
| Immigrants | Greece | 19.1 /100 | #211 | Poor 1.3% |
| Chileans | 18.8 /100 | #212 | Poor 1.3% |
| Immigrants | Sudan | 18.7 /100 | #213 | Poor 1.3% |
| Immigrants | Chile | 17.2 /100 | #214 | Poor 1.3% |
| Syrians | 16.1 /100 | #215 | Poor 1.3% |
| Bangladeshis | 15.5 /100 | #216 | Poor 1.3% |
| Cypriots | 14.9 /100 | #217 | Poor 1.3% |
| Malaysians | 13.2 /100 | #218 | Poor 1.3% |
| Immigrants | Croatia | 11.2 /100 | #219 | Poor 1.3% |
| Serbians | 9.6 /100 | #220 | Tragic 1.3% |
| Sub-Saharan Africans | 8.3 /100 | #221 | Tragic 1.3% |
| Ukrainians | 8.3 /100 | #222 | Tragic 1.3% |
| Hispanics or Latinos | 7.7 /100 | #223 | Tragic 1.3% |
Demographics Similar to Immigrants from the Azores by Disability Age Under 5
In terms of disability age under 5, the demographic groups most similar to Immigrants from the Azores are Tohono O'odham (2.2%, a difference of 2.2%), Menominee (2.3%, a difference of 2.8%), Tsimshian (2.4%, a difference of 7.8%), Apache (2.0%, a difference of 10.0%), and Paraguayan (2.0%, a difference of 13.2%).
| Demographics | Rating | Rank | Disability Age Under 5 |
| Chippewa | 0.0 /100 | #332 | Tragic 1.9% |
| Dutch West Indians | 0.0 /100 | #333 | Tragic 1.9% |
| Natives/Alaskans | 0.0 /100 | #334 | Tragic 1.9% |
| Pennsylvania Germans | 0.0 /100 | #335 | Tragic 1.9% |
| Paraguayans | 0.0 /100 | #336 | Tragic 2.0% |
| Apache | 0.0 /100 | #337 | Tragic 2.0% |
| Tohono O'odham | 0.0 /100 | #338 | Tragic 2.2% |
| Immigrants | Azores | 0.0 /100 | #339 | Tragic 2.2% |
| Menominee | 0.0 /100 | #340 | Tragic 2.3% |
| Tsimshian | 0.0 /100 | #341 | Tragic 2.4% |
| Alaska Natives | 0.0 /100 | #342 | Tragic 2.9% |
| Colville | 0.0 /100 | #343 | Tragic 3.3% |
| Inupiat | 0.0 /100 | #344 | Tragic 3.7% |
| Paiute | 0.0 /100 | #345 | Tragic 3.9% |
| Yup'ik | 0.0 /100 | #346 | Tragic 4.5% |