Austrian vs Irish Child Poverty Under the Age of 16
COMPARE
Austrian
Irish
Child Poverty Under the Age of 16
Child Poverty Under the Age of 16 Comparison
Austrians
Irish
14.5%
CHILD POVERTY UNDER THE AGE OF 16
96.9/ 100
METRIC RATING
90th/ 347
METRIC RANK
14.9%
CHILD POVERTY UNDER THE AGE OF 16
93.4/ 100
METRIC RATING
112th/ 347
METRIC RANK
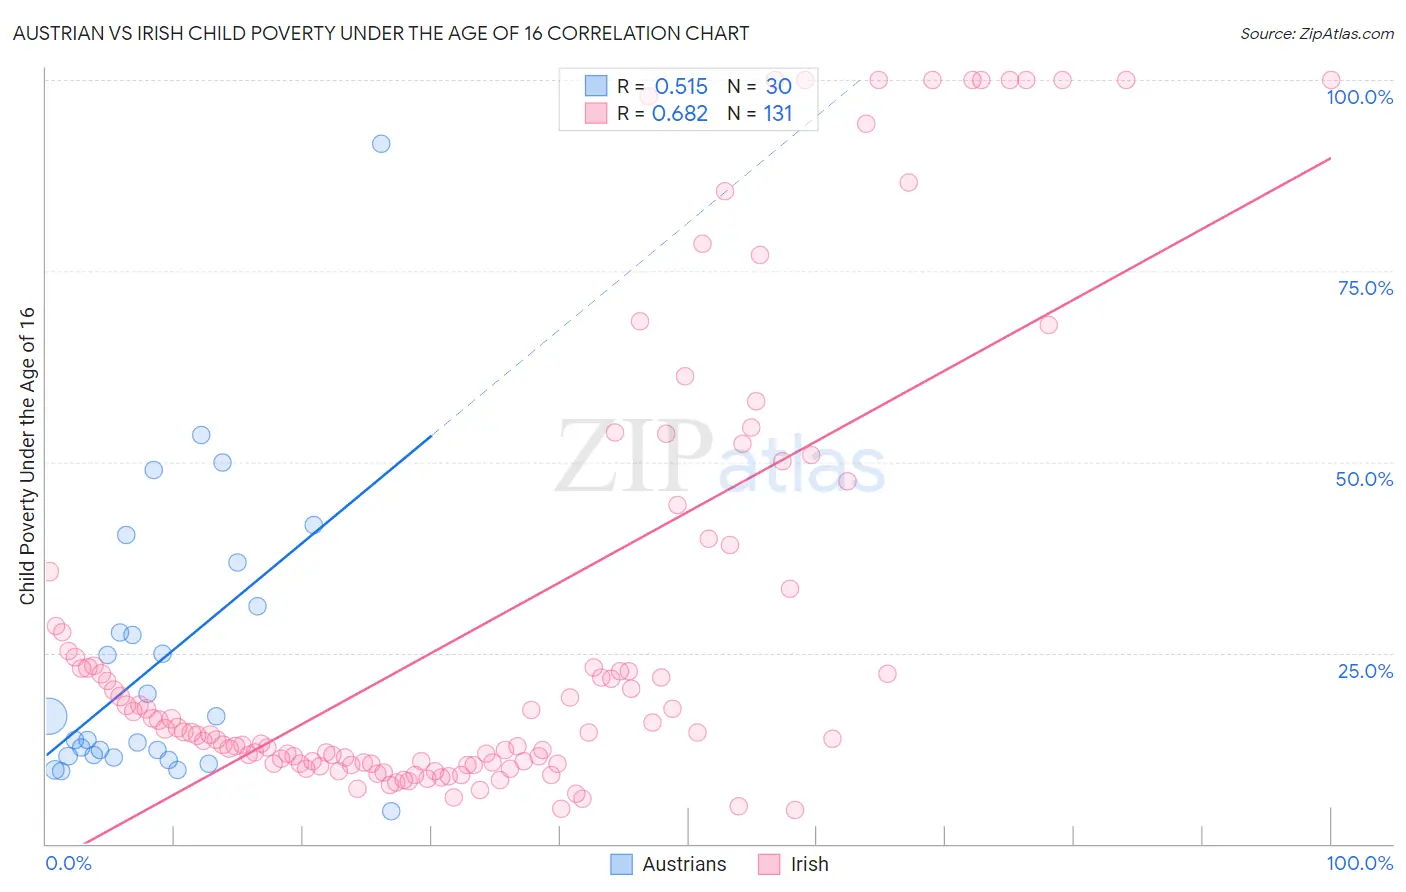
Austrian vs Irish Child Poverty Under the Age of 16 Correlation Chart
The statistical analysis conducted on geographies consisting of 445,410,621 people shows a substantial positive correlation between the proportion of Austrians and poverty level among children under the age of 16 in the United States with a correlation coefficient (R) of 0.515 and weighted average of 14.5%. Similarly, the statistical analysis conducted on geographies consisting of 565,748,670 people shows a significant positive correlation between the proportion of Irish and poverty level among children under the age of 16 in the United States with a correlation coefficient (R) of 0.682 and weighted average of 14.9%, a difference of 2.6%.
Child Poverty Under the Age of 16 Correlation Summary
| Measurement | Austrian | Irish |
| Minimum | 4.3% | 4.5% |
| Maximum | 91.7% | 100.0% |
| Range | 87.4% | 95.5% |
| Mean | 23.9% | 28.8% |
| Median | 15.1% | 14.6% |
| Interquartile 25% (IQ1) | 11.5% | 10.6% |
| Interquartile 75% (IQ3) | 31.1% | 33.4% |
| Interquartile Range (IQR) | 19.6% | 22.9% |
| Standard Deviation (Sample) | 18.8% | 29.2% |
| Standard Deviation (Population) | 18.5% | 29.1% |
Similar Demographics by Child Poverty Under the Age of 16
Demographics Similar to Austrians by Child Poverty Under the Age of 16
In terms of child poverty under the age of 16, the demographic groups most similar to Austrians are German (14.5%, a difference of 0.060%), Northern European (14.5%, a difference of 0.12%), Immigrants from North America (14.6%, a difference of 0.18%), Immigrants from Italy (14.6%, a difference of 0.21%), and Immigrants from Argentina (14.5%, a difference of 0.22%).
| Demographics | Rating | Rank | Child Poverty Under the Age of 16 |
| Egyptians | 97.2 /100 | #83 | Exceptional 14.5% |
| Immigrants | Latvia | 97.1 /100 | #84 | Exceptional 14.5% |
| Soviet Union | 97.1 /100 | #85 | Exceptional 14.5% |
| Immigrants | Argentina | 97.1 /100 | #86 | Exceptional 14.5% |
| Taiwanese | 97.1 /100 | #87 | Exceptional 14.5% |
| Northern Europeans | 97.0 /100 | #88 | Exceptional 14.5% |
| Germans | 96.9 /100 | #89 | Exceptional 14.5% |
| Austrians | 96.9 /100 | #90 | Exceptional 14.5% |
| Immigrants | North America | 96.7 /100 | #91 | Exceptional 14.6% |
| Immigrants | Italy | 96.7 /100 | #92 | Exceptional 14.6% |
| Argentineans | 96.6 /100 | #93 | Exceptional 14.6% |
| Immigrants | South Africa | 96.3 /100 | #94 | Exceptional 14.6% |
| Immigrants | Croatia | 96.1 /100 | #95 | Exceptional 14.6% |
| Immigrants | France | 95.8 /100 | #96 | Exceptional 14.7% |
| Paraguayans | 95.7 /100 | #97 | Exceptional 14.7% |
Demographics Similar to Irish by Child Poverty Under the Age of 16
In terms of child poverty under the age of 16, the demographic groups most similar to Irish are Belgian (14.9%, a difference of 0.040%), Immigrants from Denmark (14.9%, a difference of 0.060%), English (14.9%, a difference of 0.070%), Sri Lankan (14.9%, a difference of 0.070%), and Immigrants from Ukraine (14.9%, a difference of 0.13%).
| Demographics | Rating | Rank | Child Poverty Under the Age of 16 |
| Basques | 94.7 /100 | #105 | Exceptional 14.8% |
| Serbians | 94.5 /100 | #106 | Exceptional 14.8% |
| Chileans | 94.4 /100 | #107 | Exceptional 14.8% |
| Jordanians | 94.2 /100 | #108 | Exceptional 14.8% |
| Tlingit-Haida | 94.1 /100 | #109 | Exceptional 14.9% |
| English | 93.5 /100 | #110 | Exceptional 14.9% |
| Immigrants | Denmark | 93.5 /100 | #111 | Exceptional 14.9% |
| Irish | 93.4 /100 | #112 | Exceptional 14.9% |
| Belgians | 93.3 /100 | #113 | Exceptional 14.9% |
| Sri Lankans | 93.2 /100 | #114 | Exceptional 14.9% |
| Immigrants | Ukraine | 93.1 /100 | #115 | Exceptional 14.9% |
| Carpatho Rusyns | 93.1 /100 | #116 | Exceptional 14.9% |
| Immigrants | Norway | 92.8 /100 | #117 | Exceptional 15.0% |
| Immigrants | Malaysia | 92.6 /100 | #118 | Exceptional 15.0% |
| Scottish | 92.3 /100 | #119 | Exceptional 15.0% |