Slavic vs Immigrants from West Indies Male Poverty
COMPARE
Slavic
Immigrants from West Indies
Male Poverty
Male Poverty Comparison
Slavs
Immigrants from West Indies
10.5%
MALE POVERTY
91.7/ 100
METRIC RATING
103rd/ 347
METRIC RANK
13.5%
MALE POVERTY
0.0/ 100
METRIC RATING
274th/ 347
METRIC RANK
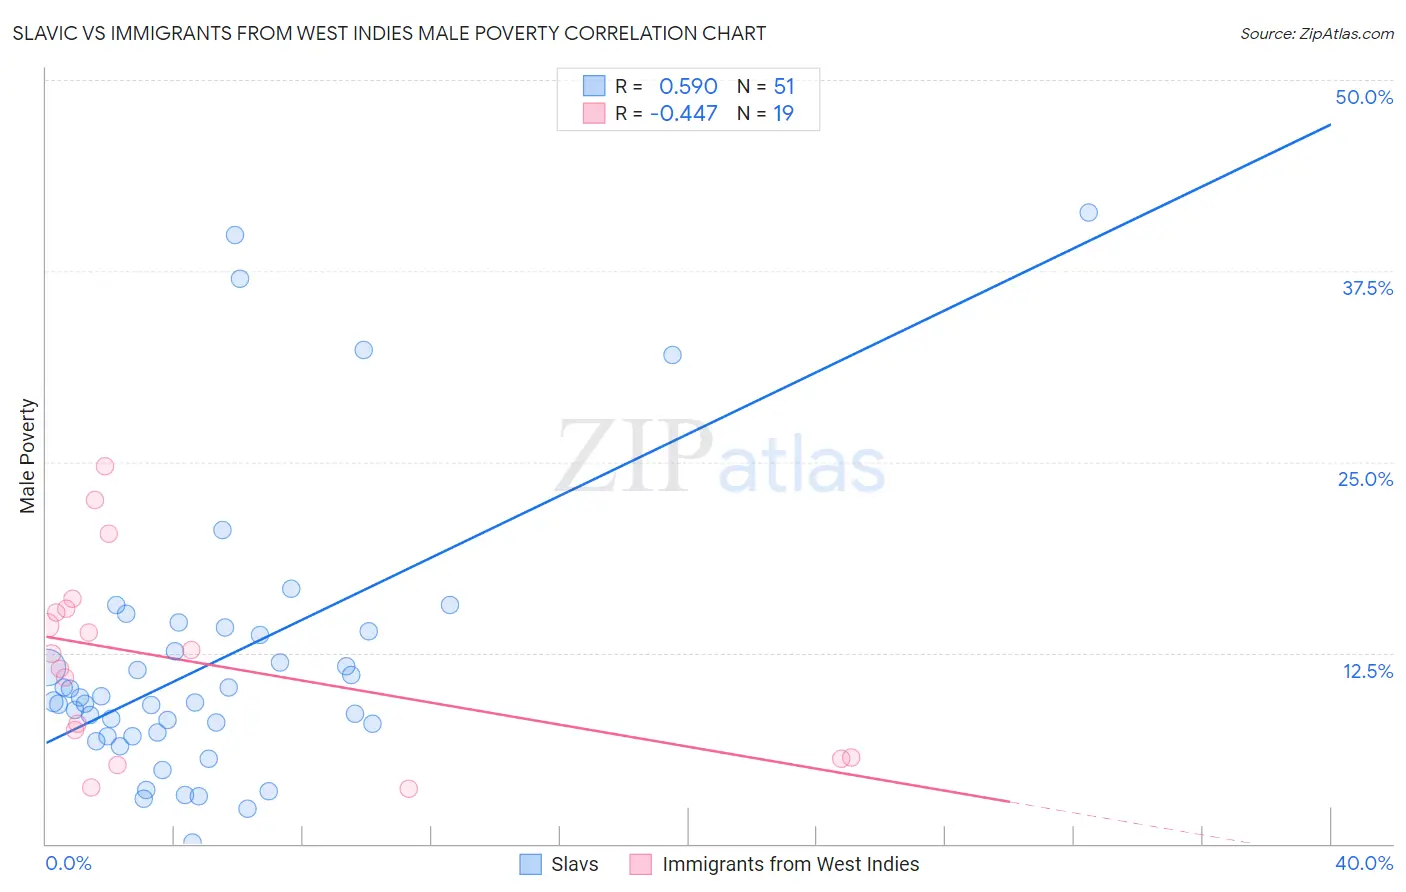
Slavic vs Immigrants from West Indies Male Poverty Correlation Chart
The statistical analysis conducted on geographies consisting of 270,742,219 people shows a substantial positive correlation between the proportion of Slavs and poverty level among males in the United States with a correlation coefficient (R) of 0.590 and weighted average of 10.5%. Similarly, the statistical analysis conducted on geographies consisting of 72,454,628 people shows a moderate negative correlation between the proportion of Immigrants from West Indies and poverty level among males in the United States with a correlation coefficient (R) of -0.447 and weighted average of 13.5%, a difference of 28.2%.
Male Poverty Correlation Summary
| Measurement | Slavic | Immigrants from West Indies |
| Minimum | 0.066% | 3.6% |
| Maximum | 41.3% | 24.7% |
| Range | 41.2% | 21.1% |
| Mean | 11.9% | 12.0% |
| Median | 9.3% | 12.5% |
| Interquartile 25% (IQ1) | 7.0% | 5.6% |
| Interquartile 75% (IQ3) | 13.9% | 15.4% |
| Interquartile Range (IQR) | 6.9% | 9.8% |
| Standard Deviation (Sample) | 9.2% | 6.2% |
| Standard Deviation (Population) | 9.1% | 6.0% |
Similar Demographics by Male Poverty
Demographics Similar to Slavs by Male Poverty
In terms of male poverty, the demographic groups most similar to Slavs are Welsh (10.5%, a difference of 0.010%), Canadian (10.5%, a difference of 0.020%), French Canadian (10.5%, a difference of 0.10%), Immigrants from Zimbabwe (10.5%, a difference of 0.11%), and Immigrants from Southern Europe (10.5%, a difference of 0.13%).
| Demographics | Rating | Rank | Male Poverty |
| Immigrants | Egypt | 93.7 /100 | #96 | Exceptional 10.4% |
| Romanians | 93.6 /100 | #97 | Exceptional 10.5% |
| Finns | 93.4 /100 | #98 | Exceptional 10.5% |
| Immigrants | Indonesia | 93.3 /100 | #99 | Exceptional 10.5% |
| Immigrants | Latvia | 92.8 /100 | #100 | Exceptional 10.5% |
| Immigrants | Zimbabwe | 92.0 /100 | #101 | Exceptional 10.5% |
| French Canadians | 91.9 /100 | #102 | Exceptional 10.5% |
| Slavs | 91.7 /100 | #103 | Exceptional 10.5% |
| Welsh | 91.6 /100 | #104 | Exceptional 10.5% |
| Canadians | 91.6 /100 | #105 | Exceptional 10.5% |
| Immigrants | Southern Europe | 91.3 /100 | #106 | Exceptional 10.5% |
| Laotians | 91.2 /100 | #107 | Exceptional 10.5% |
| Portuguese | 91.0 /100 | #108 | Exceptional 10.6% |
| Albanians | 90.6 /100 | #109 | Exceptional 10.6% |
| Argentineans | 90.1 /100 | #110 | Exceptional 10.6% |
Demographics Similar to Immigrants from West Indies by Male Poverty
In terms of male poverty, the demographic groups most similar to Immigrants from West Indies are Chickasaw (13.5%, a difference of 0.070%), Immigrants from Bahamas (13.5%, a difference of 0.37%), Barbadian (13.6%, a difference of 0.62%), Immigrants from Latin America (13.6%, a difference of 0.82%), and Bangladeshi (13.6%, a difference of 0.97%).
| Demographics | Rating | Rank | Male Poverty |
| Immigrants | Jamaica | 0.1 /100 | #267 | Tragic 13.3% |
| Sub-Saharan Africans | 0.1 /100 | #268 | Tragic 13.3% |
| Guyanese | 0.0 /100 | #269 | Tragic 13.3% |
| Cree | 0.0 /100 | #270 | Tragic 13.3% |
| Spanish Americans | 0.0 /100 | #271 | Tragic 13.4% |
| Immigrants | Bahamas | 0.0 /100 | #272 | Tragic 13.5% |
| Chickasaw | 0.0 /100 | #273 | Tragic 13.5% |
| Immigrants | West Indies | 0.0 /100 | #274 | Tragic 13.5% |
| Barbadians | 0.0 /100 | #275 | Tragic 13.6% |
| Immigrants | Latin America | 0.0 /100 | #276 | Tragic 13.6% |
| Bangladeshis | 0.0 /100 | #277 | Tragic 13.6% |
| Belizeans | 0.0 /100 | #278 | Tragic 13.6% |
| Haitians | 0.0 /100 | #279 | Tragic 13.7% |
| Mexicans | 0.0 /100 | #280 | Tragic 13.7% |
| Yaqui | 0.0 /100 | #281 | Tragic 13.7% |