Jamaican vs Immigrants from West Indies Male Poverty
COMPARE
Jamaican
Immigrants from West Indies
Male Poverty
Male Poverty Comparison
Jamaicans
Immigrants from West Indies
13.2%
MALE POVERTY
0.1/ 100
METRIC RATING
265th/ 347
METRIC RANK
13.5%
MALE POVERTY
0.0/ 100
METRIC RATING
274th/ 347
METRIC RANK
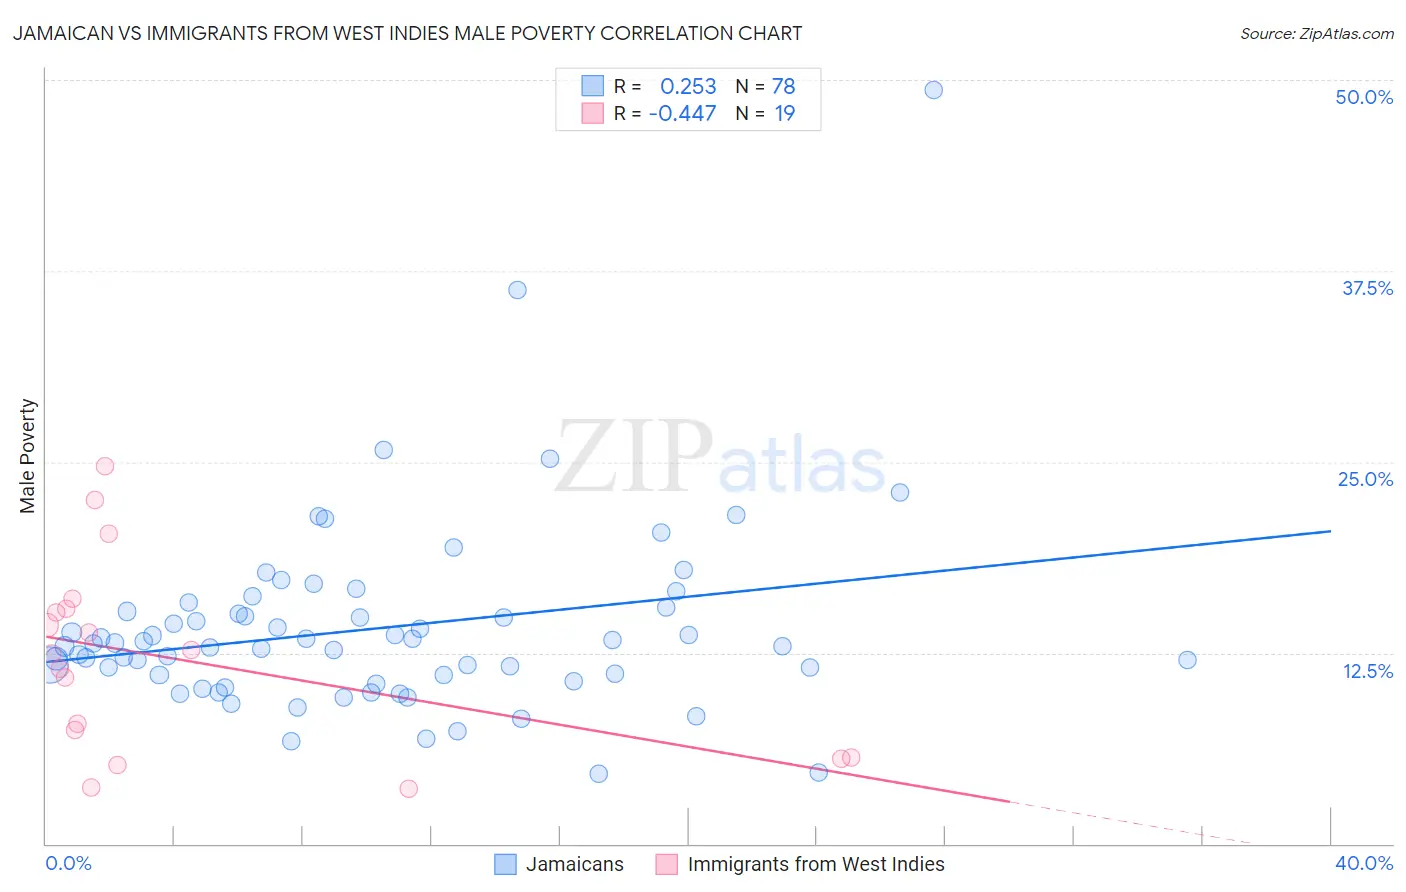
Jamaican vs Immigrants from West Indies Male Poverty Correlation Chart
The statistical analysis conducted on geographies consisting of 367,625,725 people shows a weak positive correlation between the proportion of Jamaicans and poverty level among males in the United States with a correlation coefficient (R) of 0.253 and weighted average of 13.2%. Similarly, the statistical analysis conducted on geographies consisting of 72,454,628 people shows a moderate negative correlation between the proportion of Immigrants from West Indies and poverty level among males in the United States with a correlation coefficient (R) of -0.447 and weighted average of 13.5%, a difference of 2.1%.
Male Poverty Correlation Summary
| Measurement | Jamaican | Immigrants from West Indies |
| Minimum | 4.6% | 3.6% |
| Maximum | 49.4% | 24.7% |
| Range | 44.8% | 21.1% |
| Mean | 14.1% | 12.0% |
| Median | 13.0% | 12.5% |
| Interquartile 25% (IQ1) | 11.0% | 5.6% |
| Interquartile 75% (IQ3) | 15.2% | 15.4% |
| Interquartile Range (IQR) | 4.2% | 9.8% |
| Standard Deviation (Sample) | 6.3% | 6.2% |
| Standard Deviation (Population) | 6.3% | 6.0% |
Demographics Similar to Jamaicans and Immigrants from West Indies by Male Poverty
In terms of male poverty, the demographic groups most similar to Jamaicans are Iroquois (13.2%, a difference of 0.020%), Immigrants from Guyana (13.2%, a difference of 0.14%), Immigrants from Jamaica (13.3%, a difference of 0.26%), Subsaharan African (13.3%, a difference of 0.28%), and Central American (13.2%, a difference of 0.38%). Similarly, the demographic groups most similar to Immigrants from West Indies are Chickasaw (13.5%, a difference of 0.070%), Immigrants from Bahamas (13.5%, a difference of 0.37%), Barbadian (13.6%, a difference of 0.62%), Immigrants from Latin America (13.6%, a difference of 0.82%), and Bangladeshi (13.6%, a difference of 0.97%).
| Demographics | Rating | Rank | Male Poverty |
| Cherokee | 0.1 /100 | #259 | Tragic 13.1% |
| Ottawa | 0.1 /100 | #260 | Tragic 13.1% |
| Trinidadians and Tobagonians | 0.1 /100 | #261 | Tragic 13.1% |
| Spanish American Indians | 0.1 /100 | #262 | Tragic 13.1% |
| Central Americans | 0.1 /100 | #263 | Tragic 13.2% |
| Iroquois | 0.1 /100 | #264 | Tragic 13.2% |
| Jamaicans | 0.1 /100 | #265 | Tragic 13.2% |
| Immigrants | Guyana | 0.1 /100 | #266 | Tragic 13.2% |
| Immigrants | Jamaica | 0.1 /100 | #267 | Tragic 13.3% |
| Sub-Saharan Africans | 0.1 /100 | #268 | Tragic 13.3% |
| Guyanese | 0.0 /100 | #269 | Tragic 13.3% |
| Cree | 0.0 /100 | #270 | Tragic 13.3% |
| Spanish Americans | 0.0 /100 | #271 | Tragic 13.4% |
| Immigrants | Bahamas | 0.0 /100 | #272 | Tragic 13.5% |
| Chickasaw | 0.0 /100 | #273 | Tragic 13.5% |
| Immigrants | West Indies | 0.0 /100 | #274 | Tragic 13.5% |
| Barbadians | 0.0 /100 | #275 | Tragic 13.6% |
| Immigrants | Latin America | 0.0 /100 | #276 | Tragic 13.6% |
| Bangladeshis | 0.0 /100 | #277 | Tragic 13.6% |
| Belizeans | 0.0 /100 | #278 | Tragic 13.6% |
| Haitians | 0.0 /100 | #279 | Tragic 13.7% |