German Russian vs Immigrants from Eastern Europe Female Poverty
COMPARE
German Russian
Immigrants from Eastern Europe
Female Poverty
Female Poverty Comparison
German Russians
Immigrants from Eastern Europe
14.7%
FEMALE POVERTY
2.0/ 100
METRIC RATING
228th/ 347
METRIC RANK
12.3%
FEMALE POVERTY
97.2/ 100
METRIC RATING
76th/ 347
METRIC RANK
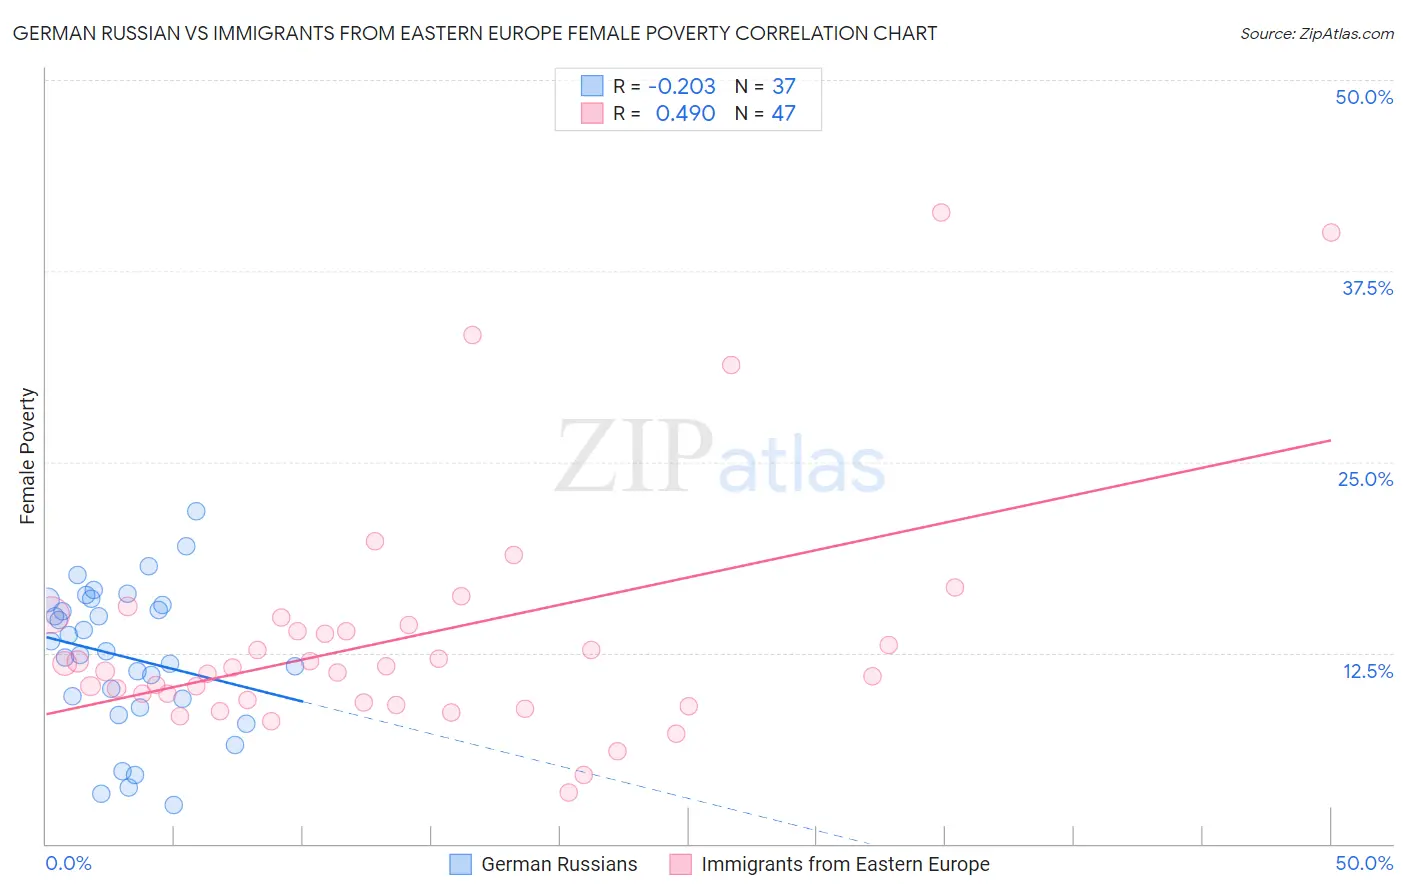
German Russian vs Immigrants from Eastern Europe Female Poverty Correlation Chart
The statistical analysis conducted on geographies consisting of 96,439,432 people shows a weak negative correlation between the proportion of German Russians and poverty level among females in the United States with a correlation coefficient (R) of -0.203 and weighted average of 14.7%. Similarly, the statistical analysis conducted on geographies consisting of 475,295,788 people shows a moderate positive correlation between the proportion of Immigrants from Eastern Europe and poverty level among females in the United States with a correlation coefficient (R) of 0.490 and weighted average of 12.3%, a difference of 19.6%.
Female Poverty Correlation Summary
| Measurement | German Russian | Immigrants from Eastern Europe |
| Minimum | 2.5% | 3.4% |
| Maximum | 21.7% | 41.3% |
| Range | 19.2% | 37.9% |
| Mean | 12.2% | 13.5% |
| Median | 12.6% | 11.6% |
| Interquartile 25% (IQ1) | 9.2% | 9.3% |
| Interquartile 75% (IQ3) | 15.8% | 14.3% |
| Interquartile Range (IQR) | 6.6% | 5.0% |
| Standard Deviation (Sample) | 4.7% | 7.9% |
| Standard Deviation (Population) | 4.7% | 7.8% |
Similar Demographics by Female Poverty
Demographics Similar to German Russians by Female Poverty
In terms of female poverty, the demographic groups most similar to German Russians are Ghanaian (14.7%, a difference of 0.060%), Immigrants from Nigeria (14.7%, a difference of 0.15%), Alaska Native (14.7%, a difference of 0.27%), Nigerian (14.8%, a difference of 0.36%), and Immigrants from Eritrea (14.6%, a difference of 0.45%).
| Demographics | Rating | Rank | Female Poverty |
| Immigrants | Cambodia | 3.7 /100 | #221 | Tragic 14.5% |
| Immigrants | Nonimmigrants | 3.7 /100 | #222 | Tragic 14.5% |
| Immigrants | Africa | 3.3 /100 | #223 | Tragic 14.5% |
| Americans | 2.8 /100 | #224 | Tragic 14.6% |
| Immigrants | Micronesia | 2.8 /100 | #225 | Tragic 14.6% |
| Immigrants | Eritrea | 2.4 /100 | #226 | Tragic 14.6% |
| Immigrants | Nigeria | 2.1 /100 | #227 | Tragic 14.7% |
| German Russians | 2.0 /100 | #228 | Tragic 14.7% |
| Ghanaians | 1.9 /100 | #229 | Tragic 14.7% |
| Alaska Natives | 1.8 /100 | #230 | Tragic 14.7% |
| Nigerians | 1.7 /100 | #231 | Tragic 14.8% |
| Osage | 1.5 /100 | #232 | Tragic 14.8% |
| Immigrants | Saudi Arabia | 1.4 /100 | #233 | Tragic 14.8% |
| Fijians | 1.1 /100 | #234 | Tragic 14.9% |
| Immigrants | Laos | 0.9 /100 | #235 | Tragic 15.0% |
Demographics Similar to Immigrants from Eastern Europe by Female Poverty
In terms of female poverty, the demographic groups most similar to Immigrants from Eastern Europe are Serbian (12.3%, a difference of 0.030%), Egyptian (12.3%, a difference of 0.040%), Immigrants from North America (12.3%, a difference of 0.11%), Slovak (12.3%, a difference of 0.16%), and Immigrants from Sweden (12.3%, a difference of 0.16%).
| Demographics | Rating | Rank | Female Poverty |
| Swiss | 97.7 /100 | #69 | Exceptional 12.2% |
| Immigrants | Belgium | 97.7 /100 | #70 | Exceptional 12.2% |
| Carpatho Rusyns | 97.6 /100 | #71 | Exceptional 12.2% |
| Cambodians | 97.5 /100 | #72 | Exceptional 12.2% |
| Zimbabweans | 97.5 /100 | #73 | Exceptional 12.3% |
| Immigrants | Canada | 97.5 /100 | #74 | Exceptional 12.3% |
| Europeans | 97.4 /100 | #75 | Exceptional 12.3% |
| Immigrants | Eastern Europe | 97.2 /100 | #76 | Exceptional 12.3% |
| Serbians | 97.2 /100 | #77 | Exceptional 12.3% |
| Egyptians | 97.2 /100 | #78 | Exceptional 12.3% |
| Immigrants | North America | 97.1 /100 | #79 | Exceptional 12.3% |
| Slovaks | 97.1 /100 | #80 | Exceptional 12.3% |
| Immigrants | Sweden | 97.1 /100 | #81 | Exceptional 12.3% |
| Jordanians | 97.1 /100 | #82 | Exceptional 12.3% |
| Immigrants | England | 96.9 /100 | #83 | Exceptional 12.3% |