Immigrants from Western Africa vs Immigrants from Eastern Europe Female Poverty
COMPARE
Immigrants from Western Africa
Immigrants from Eastern Europe
Female Poverty
Female Poverty Comparison
Immigrants from Western Africa
Immigrants from Eastern Europe
15.3%
FEMALE POVERTY
0.3/ 100
METRIC RATING
250th/ 347
METRIC RANK
12.3%
FEMALE POVERTY
97.2/ 100
METRIC RATING
76th/ 347
METRIC RANK
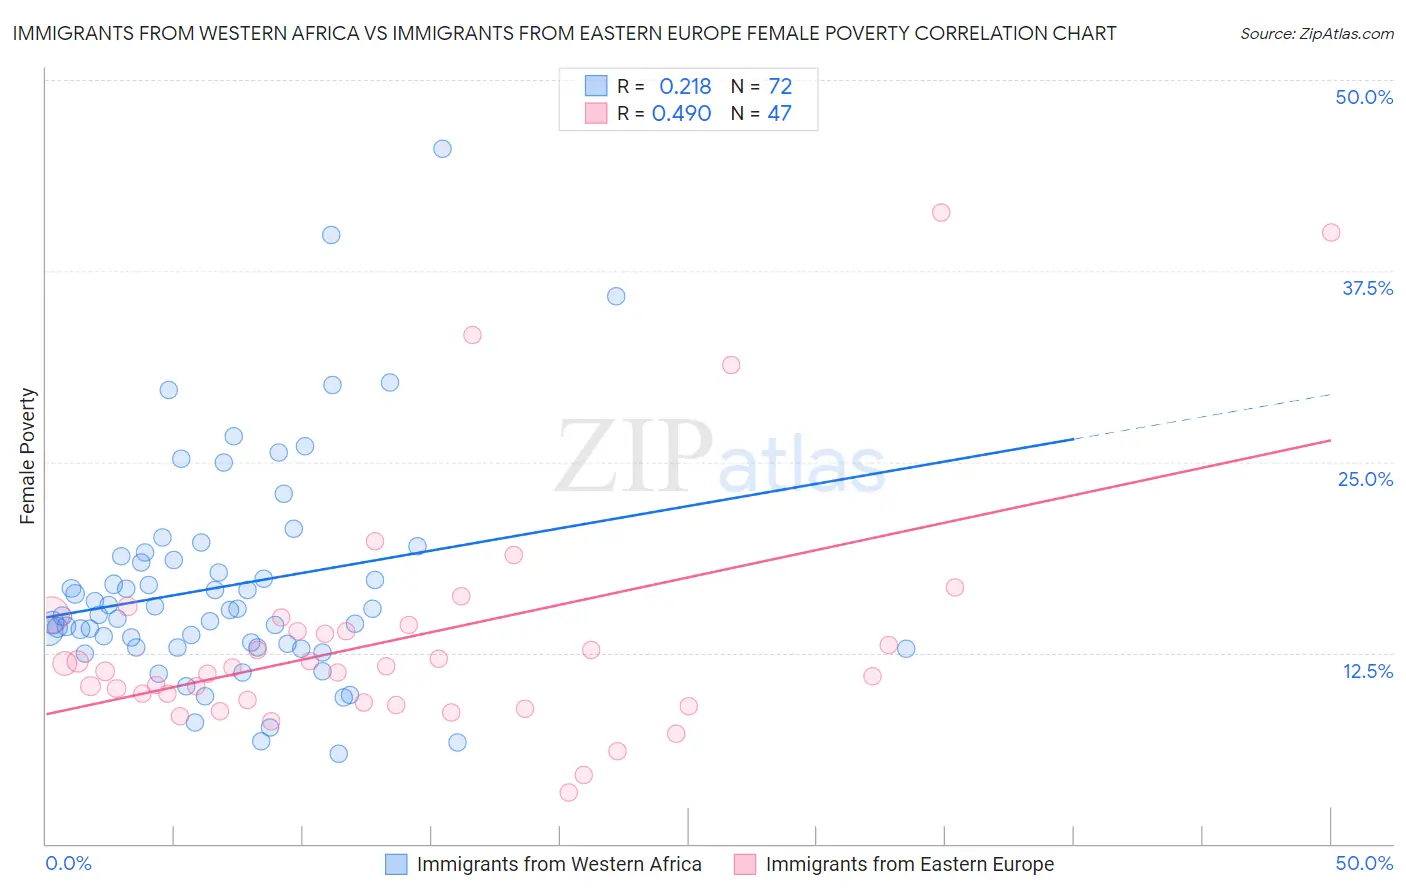
Immigrants from Western Africa vs Immigrants from Eastern Europe Female Poverty Correlation Chart
The statistical analysis conducted on geographies consisting of 357,511,733 people shows a weak positive correlation between the proportion of Immigrants from Western Africa and poverty level among females in the United States with a correlation coefficient (R) of 0.218 and weighted average of 15.3%. Similarly, the statistical analysis conducted on geographies consisting of 475,295,788 people shows a moderate positive correlation between the proportion of Immigrants from Eastern Europe and poverty level among females in the United States with a correlation coefficient (R) of 0.490 and weighted average of 12.3%, a difference of 24.8%.
Female Poverty Correlation Summary
| Measurement | Immigrants from Western Africa | Immigrants from Eastern Europe |
| Minimum | 5.9% | 3.4% |
| Maximum | 45.5% | 41.3% |
| Range | 39.6% | 37.9% |
| Mean | 16.9% | 13.5% |
| Median | 15.1% | 11.6% |
| Interquartile 25% (IQ1) | 12.8% | 9.3% |
| Interquartile 75% (IQ3) | 18.7% | 14.3% |
| Interquartile Range (IQR) | 5.9% | 5.0% |
| Standard Deviation (Sample) | 7.3% | 7.9% |
| Standard Deviation (Population) | 7.2% | 7.8% |
Similar Demographics by Female Poverty
Demographics Similar to Immigrants from Western Africa by Female Poverty
In terms of female poverty, the demographic groups most similar to Immigrants from Western Africa are Salvadoran (15.3%, a difference of 0.040%), Immigrants from Trinidad and Tobago (15.4%, a difference of 0.16%), Immigrants from Ghana (15.3%, a difference of 0.18%), Cuban (15.3%, a difference of 0.19%), and Potawatomi (15.3%, a difference of 0.19%).
| Demographics | Rating | Rank | Female Poverty |
| Nicaraguans | 0.3 /100 | #243 | Tragic 15.3% |
| Ecuadorians | 0.3 /100 | #244 | Tragic 15.3% |
| Spanish American Indians | 0.3 /100 | #245 | Tragic 15.3% |
| Cubans | 0.3 /100 | #246 | Tragic 15.3% |
| Potawatomi | 0.3 /100 | #247 | Tragic 15.3% |
| Immigrants | Ghana | 0.3 /100 | #248 | Tragic 15.3% |
| Salvadorans | 0.3 /100 | #249 | Tragic 15.3% |
| Immigrants | Western Africa | 0.3 /100 | #250 | Tragic 15.3% |
| Immigrants | Trinidad and Tobago | 0.3 /100 | #251 | Tragic 15.4% |
| Immigrants | Burma/Myanmar | 0.3 /100 | #252 | Tragic 15.4% |
| Liberians | 0.2 /100 | #253 | Tragic 15.4% |
| Trinidadians and Tobagonians | 0.2 /100 | #254 | Tragic 15.4% |
| Ottawa | 0.2 /100 | #255 | Tragic 15.5% |
| Jamaicans | 0.2 /100 | #256 | Tragic 15.5% |
| Immigrants | Jamaica | 0.1 /100 | #257 | Tragic 15.6% |
Demographics Similar to Immigrants from Eastern Europe by Female Poverty
In terms of female poverty, the demographic groups most similar to Immigrants from Eastern Europe are Serbian (12.3%, a difference of 0.030%), Egyptian (12.3%, a difference of 0.040%), Immigrants from North America (12.3%, a difference of 0.11%), Slovak (12.3%, a difference of 0.16%), and Immigrants from Sweden (12.3%, a difference of 0.16%).
| Demographics | Rating | Rank | Female Poverty |
| Swiss | 97.7 /100 | #69 | Exceptional 12.2% |
| Immigrants | Belgium | 97.7 /100 | #70 | Exceptional 12.2% |
| Carpatho Rusyns | 97.6 /100 | #71 | Exceptional 12.2% |
| Cambodians | 97.5 /100 | #72 | Exceptional 12.2% |
| Zimbabweans | 97.5 /100 | #73 | Exceptional 12.3% |
| Immigrants | Canada | 97.5 /100 | #74 | Exceptional 12.3% |
| Europeans | 97.4 /100 | #75 | Exceptional 12.3% |
| Immigrants | Eastern Europe | 97.2 /100 | #76 | Exceptional 12.3% |
| Serbians | 97.2 /100 | #77 | Exceptional 12.3% |
| Egyptians | 97.2 /100 | #78 | Exceptional 12.3% |
| Immigrants | North America | 97.1 /100 | #79 | Exceptional 12.3% |
| Slovaks | 97.1 /100 | #80 | Exceptional 12.3% |
| Immigrants | Sweden | 97.1 /100 | #81 | Exceptional 12.3% |
| Jordanians | 97.1 /100 | #82 | Exceptional 12.3% |
| Immigrants | England | 96.9 /100 | #83 | Exceptional 12.3% |