Australian vs Immigrants from Jordan Child Poverty Among Girls Under 16
COMPARE
Australian
Immigrants from Jordan
Child Poverty Among Girls Under 16
Child Poverty Among Girls Under 16 Comparison
Australians
Immigrants from Jordan
14.8%
CHILD POVERTY AMONG GIRLS UNDER 16
97.2/ 100
METRIC RATING
86th/ 347
METRIC RANK
15.6%
CHILD POVERTY AMONG GIRLS UNDER 16
87.2/ 100
METRIC RATING
141st/ 347
METRIC RANK
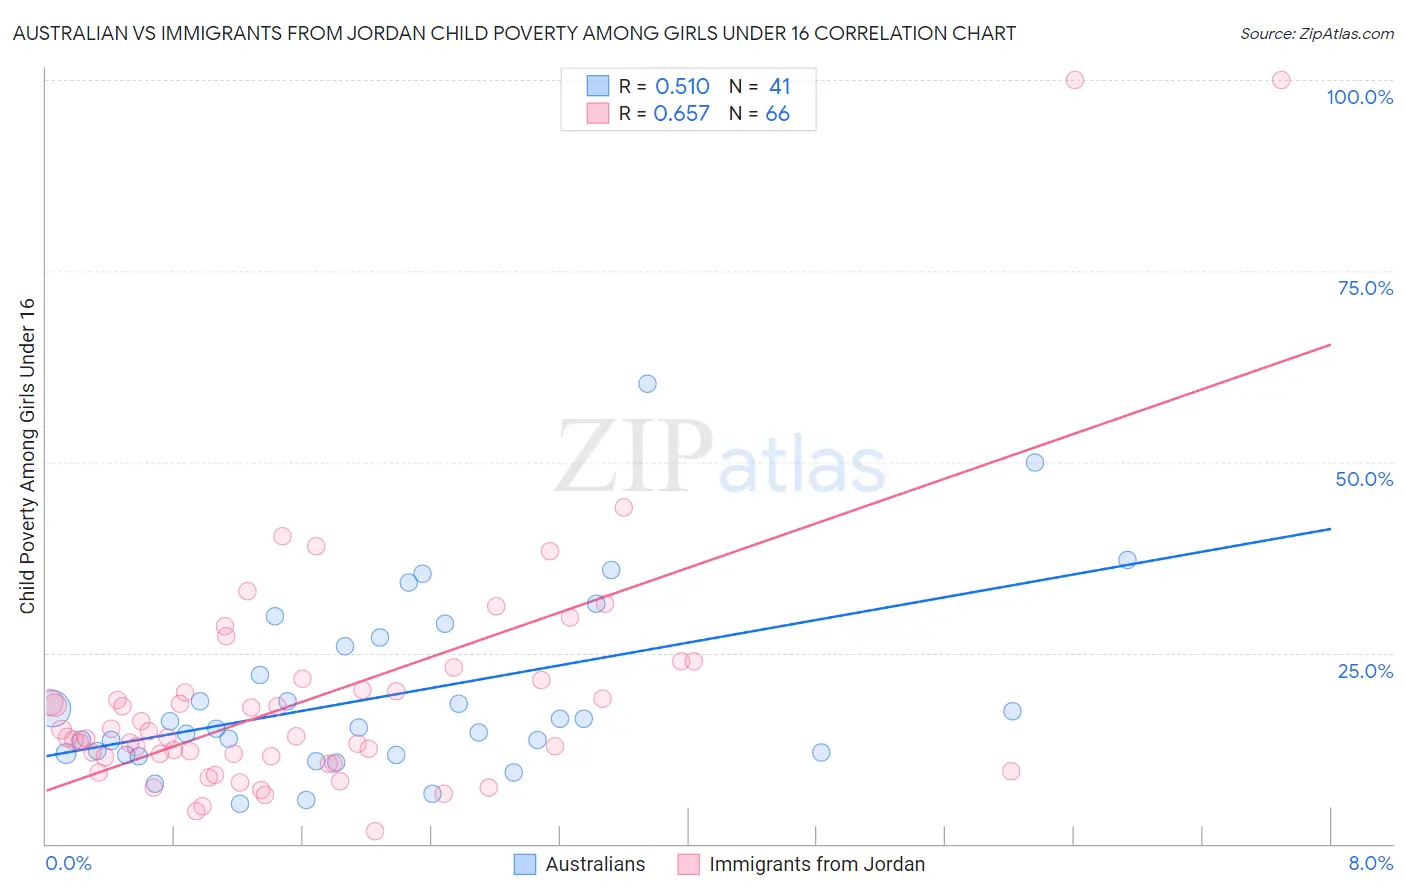
Australian vs Immigrants from Jordan Child Poverty Among Girls Under 16 Correlation Chart
The statistical analysis conducted on geographies consisting of 221,150,197 people shows a substantial positive correlation between the proportion of Australians and poverty level among girls under the age of 16 in the United States with a correlation coefficient (R) of 0.510 and weighted average of 14.8%. Similarly, the statistical analysis conducted on geographies consisting of 180,197,241 people shows a significant positive correlation between the proportion of Immigrants from Jordan and poverty level among girls under the age of 16 in the United States with a correlation coefficient (R) of 0.657 and weighted average of 15.6%, a difference of 5.2%.
Child Poverty Among Girls Under 16 Correlation Summary
| Measurement | Australian | Immigrants from Jordan |
| Minimum | 5.3% | 1.6% |
| Maximum | 60.2% | 100.0% |
| Range | 54.9% | 98.4% |
| Mean | 19.5% | 19.3% |
| Median | 15.3% | 14.0% |
| Interquartile 25% (IQ1) | 11.7% | 11.4% |
| Interquartile 75% (IQ3) | 26.4% | 21.4% |
| Interquartile Range (IQR) | 14.7% | 10.0% |
| Standard Deviation (Sample) | 11.9% | 17.0% |
| Standard Deviation (Population) | 11.7% | 16.9% |
Similar Demographics by Child Poverty Among Girls Under 16
Demographics Similar to Australians by Child Poverty Among Girls Under 16
In terms of child poverty among girls under 16, the demographic groups most similar to Australians are Finnish (14.8%, a difference of 0.020%), Swiss (14.8%, a difference of 0.040%), Immigrants from Canada (14.8%, a difference of 0.090%), Jordanian (14.8%, a difference of 0.14%), and Soviet Union (14.8%, a difference of 0.15%).
| Demographics | Rating | Rank | Child Poverty Among Girls Under 16 |
| Immigrants | Turkey | 97.9 /100 | #79 | Exceptional 14.7% |
| Egyptians | 97.9 /100 | #80 | Exceptional 14.7% |
| Ukrainians | 97.7 /100 | #81 | Exceptional 14.7% |
| Macedonians | 97.6 /100 | #82 | Exceptional 14.7% |
| Immigrants | Italy | 97.4 /100 | #83 | Exceptional 14.8% |
| Soviet Union | 97.3 /100 | #84 | Exceptional 14.8% |
| Swiss | 97.2 /100 | #85 | Exceptional 14.8% |
| Australians | 97.2 /100 | #86 | Exceptional 14.8% |
| Finns | 97.2 /100 | #87 | Exceptional 14.8% |
| Immigrants | Canada | 97.1 /100 | #88 | Exceptional 14.8% |
| Jordanians | 97.1 /100 | #89 | Exceptional 14.8% |
| Northern Europeans | 97.0 /100 | #90 | Exceptional 14.8% |
| Immigrants | Belarus | 97.0 /100 | #91 | Exceptional 14.8% |
| Austrians | 96.7 /100 | #92 | Exceptional 14.9% |
| Immigrants | North America | 96.6 /100 | #93 | Exceptional 14.9% |
Demographics Similar to Immigrants from Jordan by Child Poverty Among Girls Under 16
In terms of child poverty among girls under 16, the demographic groups most similar to Immigrants from Jordan are New Zealander (15.6%, a difference of 0.010%), Canadian (15.6%, a difference of 0.020%), Immigrants from Peru (15.6%, a difference of 0.17%), Armenian (15.5%, a difference of 0.19%), and Israeli (15.6%, a difference of 0.26%).
| Demographics | Rating | Rank | Child Poverty Among Girls Under 16 |
| Immigrants | Spain | 89.1 /100 | #134 | Excellent 15.5% |
| Czechoslovakians | 89.0 /100 | #135 | Excellent 15.5% |
| Native Hawaiians | 89.0 /100 | #136 | Excellent 15.5% |
| South Africans | 88.7 /100 | #137 | Excellent 15.5% |
| Immigrants | Vietnam | 88.2 /100 | #138 | Excellent 15.5% |
| Armenians | 87.9 /100 | #139 | Excellent 15.5% |
| New Zealanders | 87.2 /100 | #140 | Excellent 15.6% |
| Immigrants | Jordan | 87.2 /100 | #141 | Excellent 15.6% |
| Canadians | 87.1 /100 | #142 | Excellent 15.6% |
| Immigrants | Peru | 86.6 /100 | #143 | Excellent 15.6% |
| Israelis | 86.3 /100 | #144 | Excellent 15.6% |
| Welsh | 85.4 /100 | #145 | Excellent 15.6% |
| Samoans | 84.2 /100 | #146 | Excellent 15.7% |
| Slavs | 83.1 /100 | #147 | Excellent 15.7% |
| Icelanders | 82.4 /100 | #148 | Excellent 15.7% |